SciELO - Scientific Electronic Library Online

 
vol.25 número1Estudio transversal sobre la relación entre la actividad física y la calidad de la dieta en escolares de Educación Secundaria ObligatoriaEstado nutricional y condiciones de vida de escolares rurales de Tucumán, Argentina: un estudio observacional transversal índice de autoresíndice de assuntospesquisa de artigos
Home Pagelista alfabética de periódicos  

Serviços Personalizados

Journal

Artigo

Indicadores

Links relacionados

  • Em processo de indexaçãoCitado por Google
  • Não possue artigos similaresSimilares em SciELO
  • Em processo de indexaçãoSimilares em Google

Compartilhar


Revista Española de Nutrición Humana y Dietética

versão On-line ISSN 2174-5145versão impressa ISSN 2173-1292

Rev Esp Nutr Hum Diet vol.25 no.1 Pamplona Jan./Mar. 2021  Epub 08-Nov-2021

https://dx.doi.org/10.14306/renhyd.25.1.1161 

INVESTIGATIONS

BMI-BFMNU: a structural index linked to fat mass

IMC-BFMNU: un índice estructural relacionado a la masa grasa

José Miguel Soriano del Castilloa  b  *  , Paola Sechic  , Pietro Marco Bosellic 

a Food & Health Lab, Instituto de Ciencia de Materiales, Universidad de Valencia, Paterna, Spain.

b Unidad Mixta de Investigación en Endocrinología, Nutrición y Dietética Clínica, Universidad de Valencia-Instituto de Investigaciones Sanitarias La Fe, Valencia, Spain.

c Dipartimento di Bioscienze, Facoltà di Scienze e Tecnologie, Università degli Studi di Milano, Milano, Italy.

Abstract

Introduction:

Body mass index (BMI) provides little information on body composition. For example, two people with the same BMI might have different body compositions. In this sense, the development of a new BMI able to provide body composition information is of clinical and scientific interest. The aim of the study was to suggest a new modified BMI formula.

Material and Methods:

A total of 108 subject, females 56 and males 52, 0-73 years old, in various physiopathological conditions were evaluated. Data were collected and processed by a program that through anthropometric measurements calculates classic BMI, volume, surface, V/S (that we can defined like a body-thickness “pseudospessore”) and the new BMI-BFMNU.

Results:

The basic formula (BMI = Body Mass [kg] / Height [m2]) uses the height squared as the value of the body surface, although this is only an approximation of the real surface, whereas using the real surface instead, the new BMI reflects better the ratio between the body volume and its surface. The ratio called “pseudospessore” is already used in literature from the BFMNU (Italian acronym refereed to Biologia e Fisiologia Modellistica della Nutrizione Umana) method and has been shown to be related to the amount of fat.

Conclusions:

Using the BMI-BFMNU, it is possible to obtain an indication of the body structure related to the amount of fat. The consequence is that the obtained numerical values do not coincide with the traditional BMI's values and will refer to different normal ranges. For instance, a person may be in the range of normal weight for both BMI measurements, but only the BMI-BFMNU detects whether a person has a higher or lower fat content considering the individual's category. This study opens up to new possible future developments on the application of the new BMI that will allow a more accurate assessment and classification of patients.

Keywords: Anthropometry; Body Weights and Measures; Body Mass Index; Adipose Tissue; Obesity

Resumen

Introducción:

El índice de masa corporal (IMC) proporciona poca información sobre la composición corporal. Por ejemplo, dos personas con el mismo IMC pueden presentar composiciones corporales muy diferentes. Por tanto, sería de gran interés clínico y científico encontrar un nuevo IMC que proporcione información adicional sobre la composición corporal. El objetivo del estudio fue encontrar una nueva fórmula de IMC.

Material y Métodos:

Un total de 108 sujetos, 56 mujeres y 52 hombres, de entre 0-73 años, con diversas condiciones fisiopatológicas fueron evaluados. Los datos fueron recolectados y procesados por un programa que a través de medidas antropométricas calculó el IMC clásico, volumen, superficie, V/S (que puede ser definido como pseudoespesor corporal “pseudospessore”) y el nuevo IMC-BFMNU.

Resultados:

La fórmula básica (IMC = Masa corporal [kg] / Altura [m2]) usa la altura al cuadrado como el valor de la superficie corporal, aunque esto es sólo una aproximación de la superficie real, mientras que, al usar la superficie real, el nuevo IMC refleja mejor la relación entre el volumen corporal y su superficie. La proporción denominada “pseudoespesor” ya se utiliza en la literatura dentro del método BFMNU (acrónimo italiano referido a Biologia e Fisiologia Modellistica della Nutrizione Umana) y que se ha demostrado que está relacionada con la cantidad de grasa.

Conclusiones:

Utilizando el IMC-BFMNU, es posible obtener una indicación de la estructura corporal relacionada con la cantidad de grasa. La consecuencia es que los valores numéricos obtenidos no coinciden con los valores del IMC tradicional y se refieren a diferentes rangos de normalidad. Por ejemplo, una persona puede estar en el rango de peso normal para ambas mediciones de IMC, pero sólo el IMC-BFMNU puede detectar si una persona tiene un mayor o menor contenido de grasa considerando la categoría del individuo. Este estudio se abre a nuevos posibles desarrollos futuros sobre la aplicación del nuevo IMC que permitirá una valoración y clasificación más precisa de los pacientes.

Palabras clave: Antropometría; Pesos y Medidas Corporales; Índice de Masa Corporal; Tejido Adiposo; Obesidad

Introduction

The Body Mass Index (BMI)1 is used to classify individuals into to certain categories in conventional quickly and practically ranges2. BMI is used worldwide because it is considered an important index of mortality (risk factor)3. When the BMI increases or decreases from the range of normality there is a reduction of life expectancy4,5. In fact, increasing BMI above the normal range raises the risk of diseases such as type 2 diabetes, cardiovascular disease, joint diseases, hormonal disorder and cancer6-8. In addition, increased BMI also increases the risk of menstrual dysfunction in women of childbearing age, difficulty in conceiving, and complications in pregnancy for both mother and child. By contrast, an underweight index below 18.5kg/m2 is associated with various diseases, including anorexia nervosa, amenorrhea and osteoporosis4,9,10. Nowadays, it is important to acknowledge that BMI does not distinguish whether the change in weight is due to the amount of muscle mass, bone mass, water content or fat accumulation2,11,12. This classification is also fixed and is not adaptable to all adults, especially athletes or the elderly13. The established BMI categories are not specific enough because, taking two individuals of the same height; their classifications are based only on the variability of the mass, without considering the body composition12,14-16. The body surface area obtained by using the square of the height is only an approximation of the actual body surface area and can differ substantially between individuals with the same height17-19. This is because they have different body compositions, which differentially affect body volume. Considering, on the other hand, two people having the same body volume; the person with the higher fat content will have a lower body surface area, since the ratio between the volume and the surface area increases in relation to the increasing fat content, and vice versa.

The aim of this study is to propose a new index without altering the structural meaning, the units of measurement and the physical dimensions of BMI can provide more information, at least on the lipid component.

Material and methods

The study with 108 patients, including the informed consent procedure, was approved by the Ethical Committee of University of Milan (Italy). Data were collected and processed with the help of DIES4, a program that through anthropometric measurements calculates the classic BMI, the new BMI-BFMNU, volume, surface and body pseudospessore20.

The classic BMI is calculated using the formula:

BMI [kg * m-2] = Mass [kg] / height2[m2] = density * body Volume / height2

Therefore BMI can also be calculated as density* (volume/height2). As height square is obviously a surface area, but if we use the real surface of body instead of height square, we can calculate BMI-BFMNU as follows:

BMI-BFMNU [kg * m-2]= Mass [kg] / body surface area [m2]= density * body Volume / body Surface = density * "body-thickness" ("pseudospessore")

The body Volume/body Surface corresponds to the new size that is the pseudospessore. The term pseudospessore was not translated because it was misleading. We used a term that gave the idea but deviate from everything known, as it is totally new:

Pseudospessore [cm]= (1000 [cm3/ dm3] * V [dm3]) / (1000 [cm2/ dm2] * S [dm2]) = 0.1 * V / S 

The “pseudospessore” is used in the BFMNU method for the evaluation of the fat component:

Volume [dm3] = sum of the partial volumes of regular solids (cylinders, truncated cones, spheres, etc.) obtained from anthropometric measures.

Surface [m2] = sum of the surfaces of the partial volumes (from which must be subtracted the contact surfaces between adjacent partial volumes), obtained from the anthropometric measures.

Results

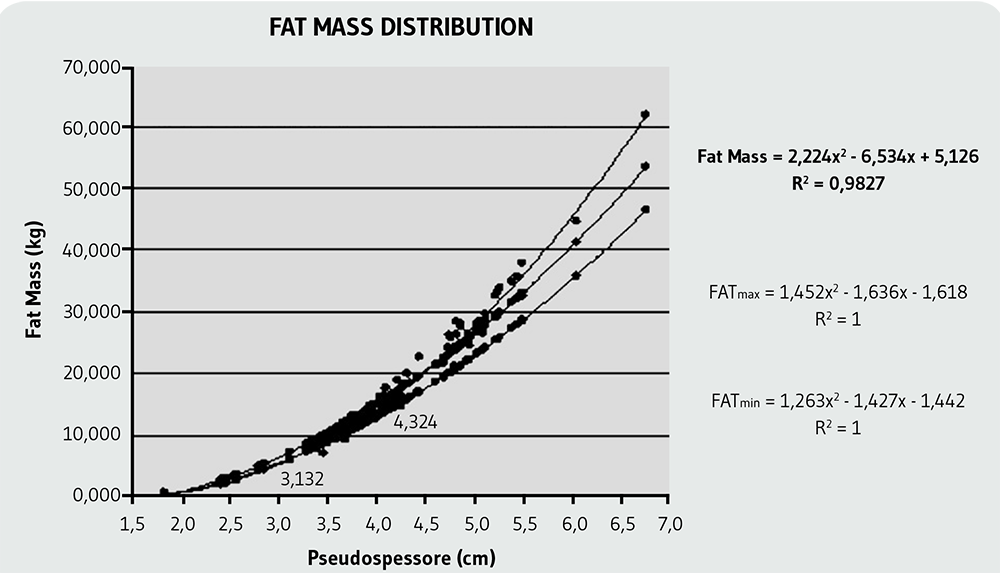
Figure 1 shows the correlation between fat mass and “body-thickness” (“pseudospessore”) demonstrating a strong correlation (R2=0.9827) with the measured values. The normal range and the top and bottom limits for the BMI-BFMNU was determined by taking a sample of patients considered “normal” as per the classic BMI (between 20 and 25kg/m2). The lower-limit curve for the obese range was determined using a sample with traditional BMI≥30kg/m2 and the upper limit curve of the underweight range using a sample with BMI≤17kg/m2. In addition, these two ranges were subdivided into intermediate intervals.

Figura 1.  Correlation between Fat Mass and body pseudospessore (V/S). 

The normal ranges explained above are related to the adult population aged ≥20 years. As mentioned previously, the ranges for individuals below 20 years are established by curves (Figure 2) in function of the age being the following normal range:

BMI-BFMNUmin= 16.3+ (34 - 16.3) * (1 - exp0.2*age)

BMI-BFMNUmax= 17.1+ (42 - 17.1) * (1 - exp0.2*age)

Figura 2.  BMI-BFMNU numerical values as a function of age. 

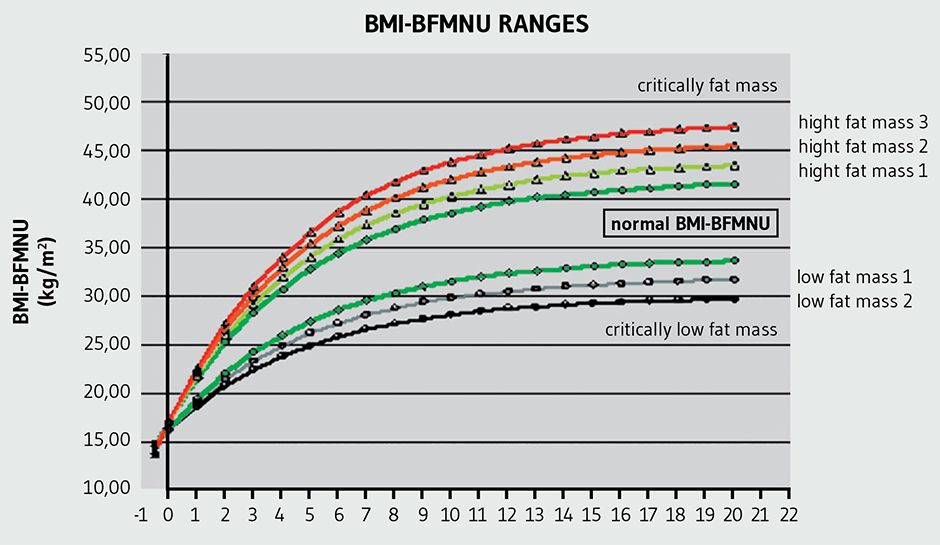
As can be seen from the curves, the point of origin coincides with the beginning of the fetal stage and the birth interval has a width so small that they cannot distinguish between the obese and underweight ranges. In the table of study individuals, the normal ranges are represented for each of them according to their age (See Tables AM1 and AM2 in additional materials: http://www.renhyd.org/index.php/renhyd/article/view/1161/733).

Discussion

The relationship between volume and surface area is present in any definition of BMI. From a dimensional point of view, this ratio provides the value of a length (length3/length2 = length). This length was defined for the first time as pseudospessore21,22.

As expected, the BMI-BFMNU features new normal ranges. This was due to the fact that in the calculation of BMI-BFMNU, the patient's real body surface appears in the denominator, instead of the surface obtained as the square of the height. The new values of BMI-BFMNU do not only give general information on the structure (height) but provide quantitative information on the body fat composition as determined by the volume/surface area (pseudospessore).

From a structural point of view, the link with the fat component of the body was indicated by the ratio between the volume and the real surface for any age. While the classic BMI, having as denominator the square of the height, depends on the age and height, BMI-BFMNU depends only on the age. A good example is a developing child. During this phase, the individual grows in height, weight and surface. Although, the development in height produces a variation of the volume and the surface. However if their ratio (pseudospessore) increases, the individual tends towards being “fat” and, if vice versa, the ratio decreases the individual tends towards being “lean”. This statement can be confirmed by the comparison between the BMI and BMI-BMNU performed on a sample of patients. Although, patients 29 and 32 (Table AM2) are both classified as normal, falling into the lower limit of the classic BMI, the BMI-BFMNU of these patients are located into the normal range, which means that they are moving to the higher fat mass. Patient 19 (Table AM2) was classified as strongly underweight according to BMI, but was about normal for BMI-BFMNU; this means that the underweight is not due to a lack of body fat mass but to other components. Patients 38 (Table AM1) and 7 (Table AM2) were classified as overweight, while BMI-BFMNU was placed in the normal range; similarly to the previous case, the overweight condition was not due to the body fat component but to other factors. Finally, the patient that shows the greatest discrepancy between the two BMI classifications, was patient 1 (Table AM2), for whom according to the classic undefined BMI, the BMI-BFMNU falls into the upper limit of the normal range. It should be emphasized that being classified in the normal range of the BMI-BFMNU means that there was an appropriate amount of body fat in relation to the overall body mass, information that the older BMI did not provide.

Therefore, if a patient was classified as overweight according to the classical BMI and normal according to the BMI-BFMNU, if they decrease their mass to return to normal (by the classical definition), they will decrease all the mass components, with the fat component decreasing by a lower percentage than the other components. The example of patient 4 (Table AM2), provides a point to be considered; although the patient presents a minimal discrepancy between the classical BMI, which was slightly above normal, and BMI-BFMNU, which was normal even though slightly below the upper limit, they show an incongruous lipid component. The incongruity lies in the fact that the lipid component was certified in the classic BMI as upper the normal range, while in the BMI-BFMU it appears just below the normal.

A possible interpretation of every incongruities is the objective difficulty of using anthropometric measurements. Particularly in children, an error made in the anthropometric measures produces an even larger error in the calculation of the volume and the surface area compared to the same type of error in adults23,24.The error in the calculation of the lipid component in the total sample (n=108) was 11.7%, about 28% for patients under 13 years (n=18) and 7% for adults (n=90) respectively.

In fact, the use of BMI was contradictory in the literature; Frankenfield et al.8 observed limmitations of this parameter to detect obesity and predict body composition. Gallagher et al.16 showed that this index was age and sex dependent when used as an indicator of body fatness, but that it was ethnicity independent in black and white adults. De Lorenzo et al.7 concluded that adiposity rather than BMI could determine the metabolic risk. Furthermore, BMI was not useful to reflect body fat, changes in body composition that take place in the different periods of life or the sexual dimorphism characteristics of body adiposity25,26.

Conclusions

In conclusions, BMI-BFMNU has the following advantages: i) provides an instant indication of the body lipid content; ii) shows the influence of the fat component in the total body mass; iii) classifies individuals according to a uniform criterion based on lipid content regardless of their heights; iv) represents an additional tool for the evaluation of dyslipidemic disorders; v) supports the preparation of optimal personal nutritional plans including patients and athletes; and vi) its value is related to the age while the BMI depends on height and weight.

Key Messages

  • 1. To search new formulas to define the nutritional status is useful.

  • 2. The new index BMI-BFMNU help to evaluate the body structure related to the amount of fat.

  • 3. This new tool classifies individuals according to a uniform criterion based on lipid content regardless of their heights.

References

1. Bogin B, Varela-Silva MI. The body mass index: the good, the bad, and the horrid. Bull Soc Suisse Anthropol. 2012; 18(2): 5-11. [ Links ]

2. Nuttall FQ. Body mass index: obesity, BMI, and health: a critical review. Nutr Today. 2015; 50(3): 117-28. [ Links ]

3. Adab P, Pallan M, Whincup PH. Is BMI the best measure of obesity? BMJ. 2018; 360: k1274. [ Links ]

4. Flegal KM, Graubard BI, Williamson DF, Gail MH. Cause-specific excess deaths associated with underweight, overweight, and obesity. JAMA. 2007; 298(17): 2028-37. [ Links ]

5. Flegal KM, Graubard BI, Williamson DF, Gail MH. Excess deaths associated with underweight, overweight, and obesity. JAMA. 2005; 293(15): 1861-7. [ Links ]

6. Davey Smith G, Sterne JA, Fraser A, Tynelius P, Lawlor DA, Rasmussen F. The association between BMI and mortality using offspring BMI as an indicator of own BMI: large intergenerational mortality study. BMJ. 2009; 339: b5043. [ Links ]

7. De Lorenzo A, Bianchi A, Maroni P, Iannarelli A, Di Daniele N, Iacopino L, Di Renzo L. Adiposity rather than BMI determines metabolic risk. Int J Cardiol. 2013; 166(1): 111-7. [ Links ]

8. Frankenfield DC, Rowe WA, Cooney RN, Smith JS, Becker D. Limits of body mass index to detect obesity and predict body composition. Nutrition. 2001; 17(1): 26-30. [ Links ]

9. Ministero della Salute. 2013. Appropriatezza clinica, strutturale e operativa nella prevenzione, diagnosi e terapia dei disturbi dell'alimentazione. [cited 2020 Oct 1]. Available from: http://www.salute.gov.it/imgs/C_17_pubblicazioni_2561_allegato.pdfLinks ]

10. Kelly SJ, Lilley JM, Leonardi-Bee J. Associations of morbidity in the underweight. Eur J Clin Nutr. 2010; 64: 475-82. [ Links ]

11. Rothman KJ. BMI-related errors in the measurement of obesity. Int J Obes (Lond). 2008; Suppl 3: S56-9. [ Links ]

12. Goacher PJ, Lambert R, Moffatt PG. Can weight-related health risk be more accurately assessed by BMI, or by gender specific calculations of Percentage Body Fatness? Med Hypotheses. 2016; 79(5): 656-62. [ Links ]

13. Chung S. Body mass index and body composition scaling to height in children and adolescent. Ann Pediatr Endocrinol Metab. 2015; 20(3): 125-9. [ Links ]

14. Mei Z, Grummer-Strawn LM, Pietrobelli A, Goulding A, Goran MI, Dietz WH. Validity of body mass index compared with other body-composition screening indexes for the assessment of body fatness in children and adolescents. Am J Clin Nutr. 2002; 75(6): 978-85. [ Links ]

15. Heymsfield SB, Heo M, Thomas D, Pietrobelli A. Scaling of body composition to height: Relevance to height-normalized indexes. Am J Clin Nutr. 2011; 93(4): 736-40. [ Links ]

16. Gallagher D, Visser M, Sepúlveda D, Pierson RN, Harris T, Heymsfield SB. How useful is body mass index for comparison of body fatness across age, sex, and ethnic groups? Am J Epidemiol. 1996; 143(3): 228-39. [ Links ]

17. Garrow J, Webster J. Quetelet's index (W/H2) as a measure of fatness. Int J Obes. 1985; 9(2): 147-53. [ Links ]

18. Burton RF. Why is the body mass index calculated as mass/height2, not as mass/height3? Ann Hum Biol. 2007; 34(6): 656-63. [ Links ]

19. Centers for Disease Control and Prevention. Body mass index: Considerations for practitioners. [cited 2020 Oct 1]. Available from: https://www.cdc.gov/obesity/downloads/bmiforpactitioners.pdfLinks ]

20. Olearo B, Soriano del Castillo JM, Boselli PM, Micó Pascual L. Assessment of body composition, through anthropometric and non-anthropometric methods, of university students from Valencia (Spain). Nutr Hosp. 2014; 30(4): 911-8. [ Links ]

21. Boselli PM. Fenomenologia della nutrizione. Milan; Raffaello Cortina Editore; 2011. [ Links ]

22. Boselli PM. El método BFMNU: Interpretación modelo fenomenológica de la nutrición. Valencia; Ediciones Mónsul, 2020. [ Links ]

23. Barlow SE, Expert Committee. Expert committee recommendations regarding the prevention, assessment, and treatment of child and adolescent overweight and obesity: summary report. Pediatrics. 2007; 120(Suppl 4): S164-92. [ Links ]

24. Daniels SR. The use of BMI in the clinical setting. Pediatrics. 2009; 124(Suppl 1): S35-41. [ Links ]

25. Prentice AM, Jebb SA. Beyond body mass index. Obes Rev. 2001; 2: 141-7. [ Links ]

26. Jackson AS, Stanforth PR, Gagnon J, Rankinen T, Leon AS, Rao DC, Skinner JS, Bouchard C, Wilmore JH. The effect of sex, age and race on estimating percentage body fat from body mass index: The Heritage Family Study. Int J Obes Relat Metab Disord. 2002; 26: 789-96. [ Links ]

FundingThe authors have no financial relationships relevant to this article to disclose.

Received: October 03, 2020; Accepted: December 07, 2020; pub: January 07, 2021

* jose.soriano@uv.es

Assigned Editor

Itziar Abete-Goñi. Universidad de Navarra. Pamplona, España.

Authors' contributions

PS, JMSC and PMB have designed the study and prepared the manuscript and PS and PMB have collected the data.

Competing interests

JMSC was editor-in-chief of the Spanish Journal of Human Nutrition and Diet and continues to be a member of the Editorial Board today. PMB created the hypothesis of the parameter used in this article and has published several articles and books on this topic. PS states that there are no conflicts of interest in preparing the manuscript.

Creative Commons License This is an open-access article distributed under the terms of the Creative Commons Attribution License