


 Servicios personalizados
 Inglés (pdf)
 Articulo en XML
 Referencias del artículo
 Enviar articulo por email
 Citado por SciELO
  Citado por Google
  Similares en
SciELO
Similares en
SciELO  Similares en Google
 Permalink
Introduction
Hospitalization is a period of acute stress and increased vulnerability that impacts the patients’ clinical and emotional status1-3. One of the most debilitating and highly prevalent complications in the hospital setting is malnutrition, which is defined as a deficiency of intake or uptake of nutrients, leading to altered body composition, function, or clinical outcome. Malnutrition is a cause and a consequence of hospitalization1,4.
The prevalence of hospital malnutrition varies from 20% to 50%5. A study in Algeria showed malnutrition prevalence among NCDs inpatients ranging from 22.86% to 52.38%6.
Hospital malnutrition is linked to two main categories of interconnected negative consequences: (1) clinical outcomes of patients, in particular: the risk of increased mortality, morbidity, readmission and late discharge and a longer length of stay (LOS) and, (2) the high costs of health care7-12.
Hospital malnutrition usually enters a vicious cycle. Patients have increased requirements, but they are unmet, causing depletion and exhaustion of energy and nutrient reserves and thus increasing their consumption needs. Reports are confirming that hospitalized patients, in general, do not consume the necessary amount of energy and nutrients to cover their requirements, which worsens their nutritional condition. Assessment of nutritional status and diagnosis of the cause of malnutrition are critically important in providing nutrients that treat both malnutrition and its causes13,14. Among the most relevant measures are those to identify and prevent the causes of malnutrition and the searching of a comprehensive training for the Dietitian-Nutritionist to have a better approach in the nutritional attention and support15.
The Coronavirus disease (COVID-19) pandemic increases the risk of hospitalization and death among people suffering from NCDs16,17. Therefore, attention to the hospitalization conditions of this category of patients is more urgent than ever.
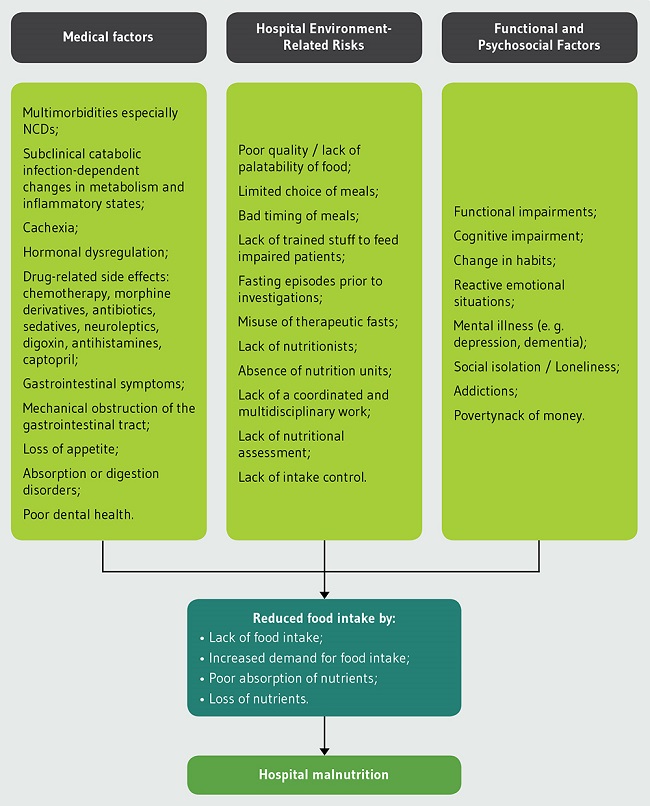
Many references indicate that the etiology of hospital malnutrition is multi-factorial. In fact, malnutrition is directly related to one factor, which is food intake, through lack of food intake or increased demand for it, poor absorption, or loss of nutrients, or all the mentioned factors together. Thus, malnutrition occurs because of several risk factors (Figure 1) that influence directly or indirectly the food intake through one or plus of the above mechanisms1,5,13,18.
The four major non-communicable diseases (NCDs): cardiovascular diseases, chronic respiratory diseases, diabetes, and cancers require hospitalization and specialist care19.
In order to improve the nutritional status of inpatients, we need to understand the current dietary intake and food and nutrition issues of inpatients20. This study aims to determine the current dietary intake in terms of quantity, quality, source, and suitability among a population of hospitalized adults with NCDs in a public hospital in Algeria.
Methodology
Data collection
A stratified random sample of 105 adult patients was recruited from a public hospital in Skikda, Algeria in a cross-sectional survey to determine the current dietary intake and food sources and nutrition issues of inpatients with NCDs during the period from the November 15th, 2020, to the December 10th, 2020.
Our study was conducted in two medical departments we were allowed in: general medicine and oncology. Pregnant women and patients who could not be interviewed for diverse reasons (end of life, impaired health status, deaf and voiceless person) were excluded from the target population.
Measurement tool
Bodyweight was measured using Seca® mechanic scale to the nearest 100 g, and body height was measured using a stadiometer to the nearest 0.1 cm.
Nutritional status was assessed using Subjective Global Assessment. Participants were defined as malnourished if they were classified as a ‘B’ or ‘C’ on SGA.
SGA considers nutrient intake, weight loss, symptoms, functional capacity, and physical exam. It classifies nutrition status as well-nourished (A), mild to moderately malnourished (B), or severely malnourished (C). A patient is rated as SGA class B if there was at least 5% weight loss without any recent stabilization or regain, dietary intake reduction, and mild loss of subcutaneous tissue. A patient is ranked as SGA class C if he/she had severe loss of subcutaneous tissue, muscle wasting, and edema21,22.
Determination of dietary intake characteristics
Dietary intake for all foods consumed on the previous day was collected via face-to-face interview using the 24 hours recall method.
The 24 hours dietary recall fulfills a set of important features that we need. Since we are dealing with sick people, it is an appropriate tool because the respondent burden is relatively low, literacy is not required, and the interview is relatively quick. It also measures dietary patterns, meal composition, and eating environment. On the other hand, evaluating the nutritional status using SGA fills any possible gap on the quantities consumed in the medium term. The interviews were supported using SUVIMAX booklet representing approximate portion sizes of food and dishes and sets of bowls, cups, dishes, and spoons to improve recall of serving sizes. The nutrients used in the final analysis were total energy, carbohydrate (including monosaccharide), protein, fat (including saturated fatty acids, Oleic acid, α-linolenic acid (ALA), linoleic acid and Cholesterol) fiber, minerals (iron calcium, magnesium, potassium, sodium, selenium, zinc, and copper) and vitamins (A, B complex, C, D, E and K). The survey period did not coincide with any major festival or events that could have potentially changed admission patterns or food intake of patients.
Diet analysis was conducted using Excel. Due to the lack of special nutritional composition tables for Algeria, energy and nutrient values for each food item were calculated using “CIQUAL Table, 2016”, an Excel-based nutrition software developed for use in France23. In CIQUAL Table, data on energy and nutrients values are available for common mixed dishes, components from combined dishes and single food items. The nutritional composition of missing dishes (Algerian traditional dishes) was calculated separately using values of single food items (Table 1).
Table 1. Energy and nutritional values of the ten traditional dishes most frequently consumed by the studied population.
| Dish | Energy (kJ)/100g | Energy (kcal)/100g | Proteins /100g | Carbohydrates /100g | Lipids /100g |
|---|---|---|---|---|---|
| Kesra (Rekhsis) | 1611.11 | 384.57 | 7.00 | 44.18 | 19.40 |
| Khobz eddar | 723.49 | 170.34 | 5.81 | 33.65 | 0.95 |
| Couscous | 255.94 | 60.92 | 1.78 | 9.27 | 1.47 |
| Chekhchoukha | 245.84 | 58.52 | 1.58 | 8.00 | 1.99 |
| Pasta in tomato sauce | 201.69 | 48.19 | 1.13 | 5.55 | 2.27 |
| Tadjine zitoune | 188.79 | 45.46 | 1.014 | 3.53 | 9.30 |
| Cooked beans (soup) | 200.52 | 48.00 | 1.83 | 5.03 | 1.83 |
| Cooked lentils (soup) | 135.68 | 32.40 | 1.59 | 3.06 | 1.29 |
| Chorba frik (Jari) | 208.73 | 49.93 | 4.85 | 1.86 | 2.43 |
| Kemmounia | 357.26 | 85.86 | 7.76 | 1.18 | 5.75 |
Data analysis
Data were analyzed using the IBM SPSS Statistics 28 software. Statistical significance was taken as P≤0.05. Normality was assessed using Kolmogorov-Smirnov test and histograms. Medians and 25th and 75th percentiles are presented for not normally distributed data, while means and SD are presented for normally distributed data.
The T test was used to compare two means for normally distributed data while the non-parametric test Mann-Whitney U test was used for non-normally distributed data. Pearson χ2 test was used to compare two proportions. Energy and protein intake of participants in this study were presented at five cut-offs points 0, 25, 50, 75 and 100% and compared to the predictive energy and protein needs that were calculated respectively with the Harris-Benedict formula increased by 10% to cover increased needs due to hospitalization and disease and by multiplying their actual weight by a factor of 1.2 g/kg/day or 1.0 g/kg/day for patients <65 or ≥65 years respectively24.
Ethical consideration
Abdul Razzaq Bouhara Hospital was the only hospital not receiving cases of Coronavirus in Skikda, for this reason it has approved our admission to conduct the research. The study was conducted according to the Declaration of Helsinki. Verbal informed consent was obtained from all individual participants included in the study by asking them directly about their desire to participate in the survey.
Results
A total of 105 participants participated in the survey. There were more female (75.20%) than male (24.80%) participants in the study. The age of patients was between 18 and 90 years old with an average of 58.21±13.69 years. The prevalence of NCDs was respectively: cancer (62.86%), cardiovascular diseases (CVD) (43.81%), diabetes (29.50%) and chronic respiratory diseases (CRD) (12.38%). An important number of participants were malnourished, defined as B/C on SGA (44.76%).
Hospital foodservices provided the three main meals according to a menu consisting of dishes from the Algerian cuisine that met average nutritional requirements and food safety standards. High protein, high-energy diets were not routinely provided. Hospital foodservices were available for free for all the patients, but the menu is the same for all patients including patients with identified particular nutrition-related medical problems such as diabetes mellitus, cancers and high-blood pressure. Due to the low acceptability of these meals, relative of patients are allowed to purchase food from outside the hospital or bring home cooked meals, patients are not obliged to accept food from the hospital. From our observation, participants ate their meals at their bedside or on their beds.
Energy and nutrient content of meals by nutritional status during hospitalization is presented in Table 2. In general, the energy intake of all participants was low at 4,805.00 kJ (1,145.35 kcal).
Table 2. Energy and nutritional values of meals during hospitalization (24 hours) by nutritional status (n=105).
| Energy/Nutrient | Well-nourished (n=58) | Malnourished (n=47) | Total (n=105) |
|---|---|---|---|
| Energy (kJ) Median ± SD | 5361.90 ± 2610.40 | 4288.89 ± 2574.08 | 4805.00 ± 2640.69 |
| Energy (kcal) Median ± SD | 1277.05 ± 621.74 | 1044.00 ± 613.93 | 1145.35 ± 629.19 |
| Protein (g) Median ± SD | 49.63 ± 28.82 | 43.78 ± 42.69 | 47.60 ± 35.64 |
| Fat (g) Median (25th-75th) | 40.99 (30.29-60.50) | 31.00 (19.00-40.81) | 36.00 (24.00-53.57) ** |
| Carbohydrate (g) Median ± SD | 188.53 ± 84.06 | 159.00 ± 78.33 | 170.00 ± 82.87 |
| Monosacharride (g) Median ± SD | 50.43 ± 31.30 | 42.00 ± 35.46 | 47.00 ± 33.25 * |
| Fibre (g) Median ± SD | 16.12 ± 6.41 | 11.60 ± 7.33 | 14.02 ± 6.99 |
| Saturated fatty acids (g) Median ± SD | 11.29 ± 6.63 | 10.00 ± 6.57 | 11.00 ± 6.60 |
| Oleic acid (g) Median ± SD | 10.38 ± 12.57 | 5.72 ± 12.41 * | 8.00 ± 12.65 * |
| a-linolenic acid (ALA) (g) Median ± SD | 0.22 ± 0.31 | 0.00 ± 0.26 * | 0.08 ± 0.30 * |
| Linoleic acid (g) Median ± SD | 6.01 ± 7.90 | 2.36 ± 4.57 * | 4.00 ± 7.05 * |
| Cholesterol (mg) Median ± SD | 119.47 ± 347.18 | 94.20 ± 216.79 | 104.00 ± 299.82 * |
| Iron (mg) Median (25th-75th) | 5.78 (4.00-8.07) | 4.00 (2.14-7.00) | 5.25 (3.25-7.81) ** |
| Calcium (mg) Median ± SD | 473.33 ± 309.88 | 349.00 ± 241.55 * | 465.56 ± 284.21 |
| Magnesium (mg) Median ± SD | 175.13 ± 80.15 | 142.00 ± 81.55 | 161.13 ± 82.71 |
| Potassium (mg) Median ± SD | 1907.57 ± 863.26 | 1648.00 ± 903.16 | 1813.55 ± 893.32 |
| Sodium (mg) Median ± SD | 1551.20 ± 893.57 | 1321.00 ± 949.85 | 1409.00 ± 920.39 |
| Selenium (µg) Median (25th-75th) | 6.00 (1.08-12.79) | 5.00 (1.10-10.69) | 5.59 (1.10-12.00) |
| Zinc (mg) Median (25th-75th) | 5.00 (4.00-6.20) | 4.00 (2.00-6.87) | 5.00 (3.00-6.47) |
| Copper (mg) Median ± SD | 1.00 ± 0.482 | 0.54 ± 5.84 | 0.87 ± 3.89 ** |
| Vitamin A (Retinol) (µg) Median (25th-75th) | 68.82 (35.60-239.83) | 68.00 (29.50-163.50) | 68.00 (32.10-163.50) |
| Vitamin B1 (mg) Median (25th-75th) | 1.00 (0.70-1.00) | 1.00 (0.00-1.00) | 1.00 (0.58-1.00) |
| Vitamin B2 (mg) Median (25th-75th) | 1.00 (0.83-1.64) | 1.00 (0.59-1.00) | 1.00 (0.79-1.38) |
| Vitamin B3 (mg) Median (25th-75th) | 8.67 (6.11-13.47) | 5.00 (2.50-11.57) | 7.00 (4.00-13.00) ** |
| Vitamin B5 (mg) Median (25th-75th) | 4.00 (3.00-5.39) | 3.00 (2.00-5.00) | 3.44 (2.64-5.00) ** |
| Vitamin B6 (mg) Median (25th-75th) | 1.00 (1.00-1.57) | 1.00 (0.94-1.89) | 1.00 (1.00-1.70) |
| Vitamin B9 (µg) Median (25th-75th) | 244.35 (162.00-352.84) | 160.00 (104.00-43.30) | 203.00 (131.00-318.00) ** |
| Vitamin B12 (µg) Median (25th-75th) | 2.00 (1.14-4.00) | 2.00 (1.00-3.70) | 2.00 (1.00-4.00) |
| Vitamin C (mg) Median (25th-75th) | 63.63 (42.54-89.56) | 48.00 (28.00-74.50) | 56.92 (37.0-84.69) ** |
| Vitamin D (µg) Median (25th-75th) | 1.039 (0.43-2.52) | 1.00 (0.09-2.00) | 1.00 (0.33-2.00) |
| Vitamin E (mg) Median (25th-75th) | 9.50 (5.07-17.78) | 4.00 (2.00-8.52) | 7.00 (4.00-14.50) ** |
| Vitamin K (µg) Median (25th-75th) | 51.65 (23.17-90.12) | 24.00 (8.50-57.24) | 35.18 (14.55-79.60) ** |
*p<0.05 on T test;
**p<0.05 on Mann-Whitney U test.
The rest of the nutrients ranged between severe deficiency and slight deficiency (Table 3)25. Furthermore, the reported intake fat, monosaccharide, carbohydrate, oleic acid, α-linolenic acid, linoleic acid, cholesterol, iron, copper and some vitamins (B3, B5, B9, C, E and K) of participants was significantly (P<0.05 on Mann-Whitney U test and T test) lower than those who were well-nourished. In the other hand, oleic acid, α-linolenic acid, linoleic acid and calcium intake were significantly different between B and C ranges of malnourished patients.
Table 3. Energy and nutritional values of meals during hospitalization (24 hours) by nutritional status vs. dietary reference values (n=105).
| Energy/Nutrient | Total (n=105) | DRV and Reference intake |
|---|---|---|
| Energy (kJ) Median ± SD | 4805.00 ± 2640.69 | 8400 |
| Energy (kcal) Median ± SD | 1145.35 ± 629.19 | 2000 |
| Protein (g) Median ± SD | 47.60 ± 35.64 | 50 |
| Fat (g) Median (25th-75th) | 36.00 (24.00-53.57) | 70 |
| Carbohydrate (g) Median ± SD | 170.00 ± 82.87 | 260 |
| Monosacharride (g) Median ± SD | 47.00 ± 33.25 | 90 |
| Fibre (g) Median ± SD | 14.02 ± 6.99 | 25 |
| Saturated fatty acids (g) Median ± SD | 11.00 ± 6.60 | ≤ 20 |
| Oleic acid (g) Median ± SD | 8.00 ± 12.65 | - |
| a-linolenic acid (ALA) (g) Median ± SD | 0.08 ± 0.30 (0.06 E%) | 0.5 E% |
| Linoleic acid (g) Median ± SD | 4.00 ± 7.05 (3.14 E%) | 4 E% |
| Cholesterol (mg) Median ± SD | 104.00 ± 299.82 | - |
| Iron (mg) Median (25th-75th) | 5.25 (3.25-7.81) | 14 |
| Calcium (mg) Median ± SD | 465.56 ± 284.21 | 800 |
| Magnesium (mg) Median ± SD | 161.13 ± 82.71 | 375 |
| Potassium (mg) Median ± SD | 1813.55 ± 893.32 | 2000 |
| Sodium (mg) Median ± SD | 1409.00 ± 920.39 | 2000 |
| Selenium (µg) Median (25th-75th) | 5.59 (1.10-12.00) | 55 |
| Zinc (mg) Median (25th-75th) | 5.00 (3.00-6.47) | 10 |
| Copper (mg) Median ± SD | 0.87 ± 3.89 | 1 |
| Vitamin A (Retinol) (µg) Median (25th-75th) | 68.00 (32.10-163.50) | 800 |
| Vitamin B1 (mg) Median (25th-75th) | 1.00 (0.58-1.00) | 1.1 |
| Vitamin B2 (mg) Median (25th-75th) | 1.00 (0.79-1.38) | 1.4 |
| Vitamin B3 (mg) Median (25th-75th) | 7.00 (4.00-13.00) | 16 |
| Vitamin B5 (mg) Median (25th-75th) | 3.44 (2.64-5.00) | 6 |
| Vitamin B6 (mg) Median (25th-75th) | 1.00 (1.00-1.70) | 1.4 |
| Vitamin B9 (µg) Median (25th-75th) | 203.00 (131.00-318.00) | 200 |
| Vitamin B12 (µg) Median (25th-75th) | 2.00 (1.00-4.00) | 2.5 |
| Vitamin C (mg) Median (25th-75th) | 56.92 (37.0-84.69) | 80 |
| Vitamin D (µg) Median (25th-75th) | 1.00 (0.33-2.00) | 5 |
| Vitamin E (mg) Median (25th-75th) | 7.00 (4.00-14.50) | 12 |
| Vitamin K (µg) Median (25th-75th) | 35.18 (14.55-79.60) | 75 |
DRV: Dietary reference values25; E%: Energy percentage.
Table 4 presents number of meals per day, source of meals and 24 hours dietary intake against energy and proteins requirements. The majority of participants indicate that they eat home-cooked meals three to four times a day. The results show a significant difference between well-nourished and malnourished patients in number and sources of meals (P<0.05 on T test) and no significant difference in energy and proteins intakes against requirements. More than 25% of the population consumes less than 50% of their real energy needs and 0% of the population meets 100% of their protein needs.
Table 4. Meal source and number, main reason for low-dietary intake of participants and dietary intake against requirement during hospitalization by nutritional status (n=105).
| Characteristics | Well-nourished (n=58) | Malnourished (n=47) | Total (n=105) |
|---|---|---|---|
| Sources of meals during hospitalization | (%) | (%) | (%) |
| Hospital nutrition department only | 1.72 | 4.25* | 3.81 * |
| Home cooked meal only | 81.03 | 74.47* | 78.09 * |
| Buying from outside only | 0.00 | 2.13* | 0.95 * |
| Multiple source | 17.24 | 19.15* | 17.14 * |
| Number of meals per day | (%) | (%) | (%) |
| ≤ 2 meals/day | 3.45 | 14.89 | 8.57 * |
| 3-4 meals/day | 60.34 | 65.96 | 62.86 * |
| 5-6 meals/day | 36.21 | 19.15 | 28.57 * |
| 24 hours dietary intake against energy requirement | (%) | (%) | (%) |
| 0% | 3.45 | 4.25 | 4.76 |
| 0%-24.9% | 3.45 | 6.38 | 4.76 |
| 25%-49.9% | 10.34 | 23.40 | 16.19 |
| 50%-74.9% | 31.03 | 21.28 | 25.71 |
| 75%-99.9% | 27.59 | 19.15 | 23.81 |
| ≥100% | 24.14 | 25.53 | 24.76 |
| 24 hours dietary intake against proteins requirement | (%) | (%) | (%) |
| 0% | 5.17 | 4.25 | 4.76 |
| 0%-24.9% | 3.44 | 25.53 | 13.33 |
| 25%-49.9% | 32.76 | 19.15 | 26.67 |
| 50%-74.9% | 34.48 | 17.02 | 26.67 |
| 75%-99.9% | 18.96 | 10.64 | 15.24 |
| ≥100% | 5.17 | 23.04 | 13.33 |
*p<0.05 on Pearson Chi-squared test.
Data from this study also showed that participants skipped main meals (breakfast, lunch, and dinner) frequently (10.48, 9.52 and 8.57%, respectively). Breakfast, lunch, and dinner contribute by 29%, 39% and 32% respectively in the total energy intake per day. Snacks meal represents 9.00% of the total energy intake of patients per day. Data also show a significant association between low-dietary intake and skipped meals, number of consumed meals and NCDs (P=0.049, P=0.034 and P=0.007, respectively). Carbohydrates, fat, and proteins represent 59.37%, 28.29% and 16.62% of the daily food ration, respectively.
Discussion
This study aimed to investigate the main characteristics of the dietary intake of inpatients with NCDs in a public hospital in Algeria. This study found that the energy intakes were deficient with a median of 4,805 kJ/day (1,145 kcal/day), while protein intakes were also slightly lower than the dietary reference values (DRV) with a median of 47.60 g/day.
The predicted energy and protein needs vary in different studies. Some studies use the health authorities’ recommendations in the concerned country. Others use formulae predicting the rest energy expenditure (REE) and the total energy expenditure (TEE)26-29.
Due to the absence of any recommendations for patients in Algeria, we preferred to calculate individual requirements for energy and protein using the Harris-Benedict formula. Comparing the predicted energy and protein values with the actual needs indicates a deteriorating nutritional status and explains the malnutrition percentage in the studied population. This result is consistent when comparing the predicted energy and protein values with the DRV. Although the DRV are used among healthy people, it may help to emphasize a lack of energy or nutrients in ill people with increased energy needs; despite any overestimation or underestimation by the Harris-Benedict equation25,30.
There have been few studies investigating the dietary intake characteristics in hospitals in Algeria or North African countries. In this study, 24.74% of the inpatients met their energy and protein requirements. Protein needs were unmet among the whole population. Leistra et al. observed that protein requirements were less met than energy requirements31.
This percentage (24.74%) was acceptable in comparison with the percentage of hospitalized adults meeting 100% of their requirements in high-income countries such as Australia (30%) and Switzerland (30%), and much higher in comparison with the percentage of hospitalized adults meeting 100% of their requirements in low-income countries like Viet-Nam (4.2%)26. According to Fernandez et al., the energy and protein intakes were 5,088 kJ (1,216 kcal) on admission and 5,058 kJ (1,209 kcal) on the 7th day of hospitalization and 51.6 g of proteins on admission and 51.8 g on the 7th day32 versus 4,805 kJ/day (1,145 kcal/day) and 47.60 g of protein in this study. In the same context, Ingadottir et al. found an energy intake of 4,469 kJ (1,068 kcal) on the admission day and 9,050 kJ (2,163 kcal) on the 4th day of hospitalization28.
This observation leads us to the importance of determining the evaluation day. In this study, we required a length of stay of at least 24 hours before assessing the inpatient's nutritional status. In other studies, the assessment is done four days after admission. An early evaluation will contribute to more rapid intervention and allows changing the nutritional treatment if necessary. An improvement in the nutritional status may indicate an effective intervention. But the delay may lead to the lack of knowledge of the true causes of malnutrition, failure of discharge home, and increased mortality rate28,31,33.
In this research, 48.57% of patients achieve ≥75% of their energy requirements, and 13.33% of patients covered ≥75% of their protein requirements. Although many hospitalized patients in different populations do not reach the recommended energy or protein intakes, it seems that achieving ≥75% of energy and protein requirements is critical. A decreased risk of complications, shorter LOS, and better body weight maintenance have been reported in general hospitalized patients at nutritional risk achieving ≥75% of their energy and protein requirements28.
In this study 78.09% of patients declare consuming self-provided food, hospital nutrition department provides food freely for all inpatients but only 3.81% of patients declare consuming hospital food as the only source of dietary intake.
The reduced food intake can be explained by several reasons like cancers31,32,34, nausea/vomiting related or not to cancer, anorexia, poor appetite, fatigue, and gastrointestinal problems31,34. The reduced hospital food consumption is due, in our opinion, to two main reasons: the inappropriate quantity (large portions) and timing and the monotony of the served food, and the lack of assistance during mealtimes, unlike the home provided food which is often eaten under the supervision of visiting relatives in small quantities. Appropriately, this is consistent with what we found about each meal's contribution to the daily energy intake, whereby lunch is the most important meal that intersects with the main “day visiting” time in the hospital while breakfast is the most skipped meal. Ridley et al.35 suggest serving small meals or meals on-demand. However, home-cooked food poses a risk to hygiene and food safety especially if they are not eaten immediately. Therefore, there is a need to govern food from different sources to ensure the quality and safety of food available on the hospital grounds26.
The hospital serves three main meals, while 28.57% of patients indicated eating at least two small mid-meals (snacks between main meals), which represented 9% of daily energy intake. Mid-meals are a known strategy to improve nutritional status particularly among patients with low appetite or early satiety36.
Some studies28,32,37 focused on the energy and protein intake from the meals provided by the hospital, then recording the proportion of the meal consumed by the subjects (0,25, 50 or 100%). Due to the low demand for hospital meals, similar studies in Algeria may not be necessary. On the contrary, a serious study about the waste resulting from the lack of consumption of meals provided by the hospital should be taken into account, as well as trying to understand the reasons for the rejection to adopt successful strategies reducing the economic burden on public hospitals in Algeria. Without neglecting the importance of well feeding patients in hospitals, reconsidering the free feeding may be efficient, where paid meals can be of higher quality. However, Tran et al. attributes in their study the reason for the low food intake to the less choices or higher cost of hospital meals than other sources26.
The optimal balance of macronutrients’ contribution to the diet has been a long-standing matter of debate though, in this study, macronutrients’ contribution to patients’ daily energy intake compared to recommendations is acceptable38-41.
Although the amount of consumed carbohydrates on average is not very large in light of the reduced energy intake, the proportion of simple sugars may be a cause for concern. According to Clemens et al., the 2015-2020 Dietary Guidelines for Americans recommended limiting dietary sugar to 10% of total energy in an effort to reduce the risk of noncommunicable diseases. Sugars, have been charged as potential causes of diabetes, cardiovascular diseases and metabolic syndrome42.
Participants in this survey also reported 14.02 g/day of dietary fiber intake for 1,145.35 kcal; this intake is slightly less than the adequate intake for fiber which is 14 g total fiber per 1,000 kcal, or 25 g for adult women and 38 g for adult men. Higher intakes of dietary fiber reduce the risk of developing several chronic diseases, including cardiovascular disease, type 2 diabetes, and some cancers43. The low-fiber intake might be associated with reduced consumption of fruit and vegetables26.
The study showed a significant difference between well-nourished and malnourished inpatients in fat consumption. The consumption of α-linolenic acid was much less than recommended, which affects the suggested n-6/n-3 ratio. Current research indicates that ALA may play a crucial role in many physiological functions, and a high n-6/n-3 ratio may promote the pathogenesis of many diseases, including cardiovascular disease, cancer, osteoporosis, and inflammatory and autoimmune diseases44. This, together with the severe deficiency of most vitamins and minerals associated with a lack of food intake, can contribute to the deterioration of the health status of patients.
Based on these findings, we advise to (1) investigate and treat reduced intake causes like nausea, (2) increase habitual energy and protein intake by providing ONS (oral nutritional supplements) and tube feeding efficiently, (3) improve the hospital meals characteristics particularly by providing patient support, (4) create awareness among patients and patients’ relatives regarding nutritional needs.
This study has a number of strengths including the reporting of actual intake based on 24 hours records from participants, the confidence in the dietary intake data, the collection of accurate information related to the nutritional status, and the attention to younger patients and patients with a higher BMI that have higher absolute protein and energy requirements, which lower the chances of achieving these requirements while most studies focus on old patients with low BMI31. Limitations included the critical study period that coincided with the spread of the Coronavirus and the strict protocols and the administrative procedures associated with it.
Conclusions
In conclusion, studying the characteristics of the dietary intake is important to maintain the nutritional status of inpatients. The study confirmed that the current food supply in Algerian hospitals including non-regulated sources is not able to meet the nutritional requirements of patients and contributes to malnutrition and thus higher rates of morbidity and mortality. There is a need to improve hospital nutritional services to improve patient outcomes, considering the system-related and the patient-related issues. Supporting patients at mealtimes and nutritional education among patients’ families are also solutions to improve patient nutritional status.

