


 Serviços customizados
 Inglês (pdf)
 Artigo em XML
 Referências do artigo
 Enviar este artigo por email
 Citado por SciELO
  Citado por Google
  Similares em
SciELO
Similares em
SciELO  Similares em Google
 Permalink
Key messages
Regular and low-calorie sugar-sweetened beverages (SSBs) differ in their glucose, fructose and sucrose concentrations, but do not differ in their free fructose concentrations.
The amount of sugars is variable in SSBs, even within the same type of beverage.
Cola drinks and liquid juices are the beverages with the highest free fructose content.
Introduction
Sugar-sweetened beverages (SSBs) consumption has increased in recent years in children and adolescents, being a public health problem worldwide1.
SSBs are defined as any consumable non-alcoholic water-based beverage containing significant amounts of free sugars, principally glucose, fructose and sucrose. They are energy-dense and have low nutritional value. The spectrum of SSBs includes carbonated beverages (sodas), fruit drinks, flavoured waters, sports drinks, and energy drinks2,3.
According to the Argentina National Survey of Nutrition and Health, 36.7% of the population reported consuming SSBs at least once daily, and the consumption was higher in children and adolescents (46%) than in adults (32.9%)4. The HidratAR study -carried out on 800 people under 65 years-showed that the average liquid intake is composed of 50% of SSBs, 29% of sugar-free drinks, and 21% of water. These “empty calories” represent between 9 and 15% of the daily intake. The apparent consumption of SSBs in Argentina is represented mainly by sodas, fruit and powdered juices with an average consumption of 181 and 101 mL/Adult Equivalent/day (adult male, 30 to 59 years old, with moderate activity, and an energy requirement of 2700 kcal), respectively5.
Fructose syrup is one of the most sweeteners used by industry, especially high-fructose corn syrup (HFCS), made up of 55% fructose and 45% glucose and sucrose. HFCS has been replacing other nutritive sweeteners since 1980 and currently represents more than 40% of the total consumption of these products worldwide6. HFCS can be manufactured to have variable fructose contents, even can have 90% fructose. This strategy is both feasible and allowable under current regulations, as current FDA guidelines for use of HFCS-55 as an ingredient only require it to be a minimum of 55% fructose, allowing to use of HFCS-907.
Fructose was recommended for a long time as a “sugar for diabetics” due to its very low-glycemic index. However, recent studies showed that a high percentage of the total fructose absorbed is rapidly transferred to the liver, where it is metabolized to give rise to glucose, lactate, and fatty acids8. Experimental evidence suggests that excessive fructose consumption promotes metabolic effects such as steatosis, hypertriglyceridemia, and insulin resistance9. There is also a significant number of published works, including several meta-analyses, in which it is concluded that the effects of high fructose consumption are not different from those that would derive from an intake of the same level of other sugars, such as sucrose and glucose10-12.
Consuming excess sugar is associated with a higher energy intake, which, since it is not regulated by the same satiety mechanisms of solid foods, can lead to a higher metabolic risk. Previously published papers measured the sugar content of SSBs but did not distinguish between regular and low-calorie. The aim of this work was to determine glucose, fructose, free fructose and sucrose content in regular and low-calorie Argentinian SSBs, and to compare the total amount of sugars measured with those declared on the nutritional label.
Methodology
Selected sugar-sweetened beverages
Popular SSBs were purchased at the different points of sale where the population has access, from Rosario, Santa Fe, Argentina, during 2014-2015. Regular and low-calorie beverages according to the nutritional label were selected. Collected samples were catalogued with an alphanumeric code to avoid measurements bias. Samples included cola drinks, liquid juices, flavoured waters, powdered juices, and other carbonated beverages of different brands. Glucose, fructose, free fructose and sucrose concentrations were measured by colorimetric technique13. Samples were stored at -20 °C until the determinations were made.
Chemical measurements were carried out following standard operating protocols. The measurements were carried out on duplicates under strict quality control. The value of a sample was rejected when the coefficient of variation exceeded 10%. Simultaneously, quality control solutions of known concentration were processed, if the standard deviation units were outside the range [-2, 2], the measurement of the entire batch of samples was repeated.
Chemical measurements
Glucose measurement: Glucose concentration was measured by commercial kit (Wiener Laboratories enzymatic glycaemia, Rosario, Argentina). The method uses glucose oxidase and the colour developed is proportional to the glucose concentration. Glucose standars (0.5, 1, 2, 3 g/L) and samples were prepared according to the manufacturer’s instructions and the absorbance was measured at 505 nm with a Perkin Elmer spectrophotometer, lambda 11, using 2 µl of sample.
Sucrose measurement: Sucrose concentration was determined indirectly by measure the amount of glucose released when the acid hydrolysis of the disaccharide occurred. The hydrolysis of sucrose was carried out in an acid medium at 100 °C for 30 minutes. Five µl of HCl 37% P/P density: 1.18 g/mL per 100 µl of sample were used. 200 µl of distilled H2O was added and heated under reflux with a condenser attached to the tube. After hydrolysis, the total glucose content of the sample was determined spectrophotometrically (using the glucose measurement technique previously described) and by difference with the glucose value determined in the unhydrolyzed samples (free glucose) the amount of glucose released by the hydrolysis of sucrose. Then the sucrose concentration was calculated considering that each 342 g of sucrose (1 mol) is released 180 g of glucose (1 mol).
Fructose measurement: Fructose concentration was determined by Roe method14 in hydrolysed samples. It is based on the reaction of fructose with resorcinol in an acid medium, generating a coloured product whose concentration determine spectrophotometrically. Sample (0.2 mL) or standard solution of fructose (0.1/ 0.05/ 0.025 mg/mL of fructose in solution with benzoic acid) were incubated at 80 °C for 8 minutes with 0.2 mL of 0.1% resorcinol solution in ethanol and 0.6 mL of HCl 30% P/V. After bringing to room temperature, the absorbance at 490 nm was measured in a Perkin Elmer Lambda 11 spectrophotometer. Free fructose concentration was obtained by the difference between the moles of total fructose (measured after hydrolysis of sucrose) and the moles of sucrose.
In summary, the glucose content in SSBs was measured in samples by colorimetric technique. The sucrose content was calculated by difference between free glucose and total glucose. Total glucose is the amount of glucose measure after acid hydrolysis. Fructose content in SSBs was calculated by difference between total fructose (measure after acid hydrolysis) and sucrose content (Figure 1).

Statistical analyses
The variables had not normal distribution (Shapiro Wilk test, p<0.05) for which the data were expressed as median [range], and comparisons between groups were made with the Mann Whitney test to compare between 2 groups, and Kruskal Wallis to compare more than 2 groups. In all cases, a significance level of 5% was used. Using the results from the laboratory for the beverage samples, we calculated total sugar content (g/L) by summing the fructose, glucose, and sucrose results. The total sugar content as assessed by the laboratory was compared to the total sugar content reported on the nutrition label. Fructose glucose ratio (FGR) was calculated by making the quotient between the sum of the fructose plus half the sucrose divided by the sum of the glucose plus half the sucrose. A value greater than 1 indicates a greater quantity of fructose than glucose, equal to 1 same quantity of fructose and glucose, and less than 1 more quantity of glucose than fructose13.
The sample size was calculated using the power test and the data obtained from the experiments were analysed with the R program, version 3.2.215.
Results
Analyses sugar composition of SSBs
Fifty-three samples were analysed: Flavoured Waters (n=10), Cola Drinks (n=12), Liquid Juices (n=5), Powdered Juices (n=11), and Others (carbonated drinks, n=15). In addition, low-calorie (n=26) were compared with regular (n=27) as indicated on the nutrition labeling. Table 1 shows the values of glucose, sucrose, fructose in all analysed SSBs (n=53).
Table 1. Sugar composition of SSBs.
| Sugars | Concentration (g/L) | IQR (g/L) |
|---|---|---|
| Glucose | 0.72 [0-18.63] | 2.94 |
| Sucrose | 14.71 [0-162.14] | 40.87 |
| Fructose | 20.72 [0-83.44] | 31.12 |
| Free fructose | 3.72 [0-60.16] | 19 |
Data are shown as median [range].
Table 2 shows the values of the variables measured in the different SSBs classified according to their label (regular or low-calorie). It observed that low-calorie beverages have less significant amount of glucose, fructose and sucrose (Man Withney test, p<0.05) but there is not significative difference in free fructose content.
Table 2. Sugar composition from regular and low-calorie SSBs.
| Beverage | Glucose (g/L) | Sucrose (g/L) | Fructose (g/L) | Free fructose (g/L) |
|---|---|---|---|---|
| Regular | 1.98 [0-25.75]a | 35.81 [0-144.62]a | 31.59 [0-83.44]a | 9.8 [0-60.16]a |
| Low-calorie | 0.29 [0-8.59]b | 4.76 [0-162.14]b | 4.13 [0-37.82]b | 1.85 [0-33.96]a |
Data are shown as median [range]. Different letters between rows of the same column indicate significant differences between beverages, Mann Whitney test (p<0.05).
Figure 2 shows the median and range of the variables measured in the different types of beverages. In each group, their respective normal and low-calorie versions are included. Cola drinks and liquid juices are the beverages with the highest fructose content and powered juices provide the least.
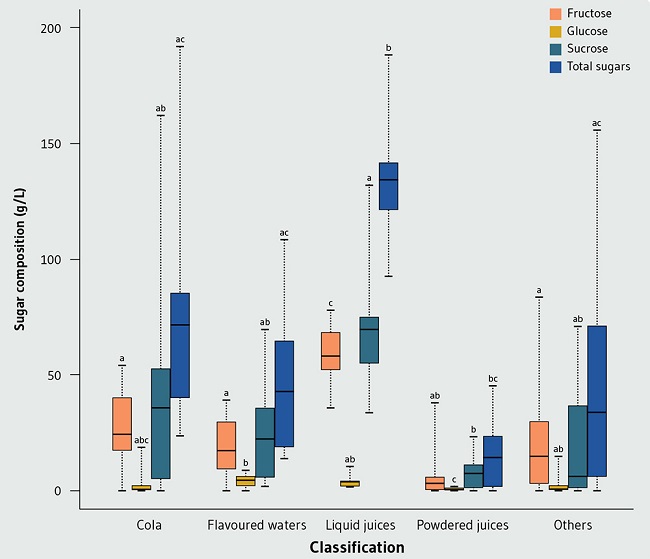
Table 3 shows the total sugar measured and theoretical (from nutrition facts label) according to the type of drink (regular or low-calorie). The amount measured significantly differs from the amount declared on the nutritional label in low-calorie beverages.
Table 3. Total sugar amount measured and declared in regular and low-calorie.
| Regular | Low-calorie | |
|---|---|---|
| Total sugar measured (g/L) | 73.26 [15.84-191.99]a | 15.62 [0.10-162.48]a |
| Total sugar from label (g/L) | 75 [6.5-125]a | 0 [0-60]b |
Data are shown as median [range]. Different letters of the same column indicate significant differences between total sugar measured and total sugar from nutrition facts label, Mann Whitney test (p<0.05).
Figure 3 shows that fructose concentration differs between the different types of SSBs (Kruskal Wallis and LSD post-test, p<0.05); liquid juices differ from the rest of the beverages. On the other hand, no significant difference was found between the values of free fructose in the different types of SSBs (Kruskal Wallis, p>0.05).

The median of the FGR was 1.45 [0-41.42], indicating that SSBs present higher amount of fructose than glucose. No significant difference was found in the FGR between regular and low-calorie SSBs (Mann Whitney test, p>0.05), and between different types (Kruskal Wallis test, p>0.05). All beverages present a FGR higher than 1, except the powered juices.
Discussion
Around 184,000 deaths per year could be attributable to SSBs consumption worldwide. SSBs consumption is strongly associated with increased risk of overweight/obesity, dental caries, type 2 diabetes mellitus, cardiovascular disease, and other health effects16.
WHO recommends consuming free sugars below 10% of the total energy needs, and reducing it to less than 5% for additional health benefits. This is equivalent to less than a single serving (at least 250 mL) of daily consumption of sugary drinks17. Natural fruit juices and SSBs consumption contribute the same fructose quantity, with the difference that eating fruits have many health benefits18.
According to this study, SSBs, in general, contribute on average 21 g/L of fructose, regular SSBs 32 g/L and low-calorie SSBs 4 g/L. Gay et al. analyzed the fructose content from flavoured waters with an average contribution of 50.5 g/L. Also, they estimated a daily intake of 6 g of fructose from the flavoured waters average consumption of 120 mL/d19.
Regular and low-calorie SSBs differ in their content of glucose, fructose and sucrose but do not differ in their free fructose concentration. The median of the fructose/glucose ratio is 1.45, coincident with the findings of Olmedo et al.13. SSBs can contain between 5% and 15% more free fructose than would be expected based on the assumed ratio in HFCS-553. Another study provided evidence that the amount of free fructose in some beverages is higher than expected, underestimating actual fructose consumption20.
The total amount of measured sugar is 70 g/L in regular SSBs and 15 g/L in low-calorie. A study found that regular SSBs provide an average of 100g/L of total sugars according to nutrition labeling data21. Also, the total amount of measured sugar is higher than the amount of sugar indicated by the label in low-calorie SSBs. This could be because it is allowed a difference of ± 20% between values measurements and declared according to the Argentine Food Code that in this case no was calculated22.
Cola drinks and liquid juices have a higher quantity of fructose, free fructose and total sugar amount than powdered juices and flavoured waters. The InterAmerican Heart Foundation Argentina23 analysed 184 nutritional labels of sweet drinks in Argentina and has shown that regular sodas contribute the highest sugar content (21 g/200 mL), which represents 42% of WHO recommendation (50 g/2000 kcal).
It should be noted the variability in sugars concentrations in the different types of SSBs, even in the same classification. Mexican SSBs have a higher amount of sugars than Argentinian beverages according to the information of nutritional labeling21. Besides, the labels do not the difference between specific types of sugars (especially fructose)3 and in many cases do not inform the amount of nutrients considering the real serving size, which prevents a responsible consumption of these products24. A relevant problem is the use of different types of claims related to the type and amount of sweeteners, like “diet”, “light”, “zero sugar”, “no sugar added”, and “low-calorie”; this is a confounder factor for consumers25.
This study provides evidence about the sugar composition in regular and low-calorie SSBs, noting that there is no difference in the free fructose concentration between them. Some studies have shown the effect of fructose on the eating behavior, stimulating the appetite, principally of high caloric foods25 and the prevalence of overweight and obesity in the western world has risen sharply in the past few decades and has now become stable at a high level26.
Conclusions
The SSBs include different types of beverages (cola drinks, flavoured waters, powdered juices, liquid juices). This study analyzed their fructose, glucose, and sucrose content. Statistical difference was found in the glucose, fructose content and sucrose between normal and low-calorie beverages, while no difference was found in the free fructose content. The median of the fructose/glucose ratio is 1.45, indicating that SSBs present a higher amount of fructose than glucose, and there is not significant difference between normal and low-calorie. Furthermore, cola drinks and liquid juices have the highest free fructose content and powdered juices have the least. In Argentina, it is not mandatory to declare the fructose content in the nutritional labeling. There is a few national evidence of HFCS content in food products. Although the effects of high sugar intake have been evaluated, it is necessary to continue studying the composition and effect of consuming low-calorie beverages on health, specially the free fructose content.

