


 Servicios personalizados
 Inglés (pdf)
 Articulo en XML
 Referencias del artículo
 Enviar articulo por email
 Citado por SciELO
  Citado por Google
  Similares en
SciELO
Similares en
SciELO  Similares en Google
 Permalink
Introduction
Gastric retentive dosage forms can monitor gastric emptying time and prolong the release of dosage forms in the stomach region for a longer period than the traditional dosage forms. The extended release dosage delivery forms were designed for improved drug absorption and enhanced bioavailability that opposes several difficulties1. Floating drug delivery systems (FDDS) are low density systems that have enough resilience to float over the gastric contents and persist in the stomach for an extended period. Buoyancy can improve retention time and reduce dosing frequency. An effervescent system produces gas (CO2) which increases the system density and remains buoyant inside the stomach2.
Domperidone and Famotidine are highly specific drug(s) which are used in the treatment of vomiting and hyperacidity. Domperidone acts on upper GIT to upsurge the stomach and intestine movements, allowing food to move and that controls the vomiting. Famotidine is a H2 blocker that diminishes the acid level in the stomach to get relief from indigestion and heart burn. The approximate absolute bioavailability of Domperidone is 13- 17% and Famotidine is 40-45%. This can be improved and maximized by improving bioavailability and by increasing retention of these drug(s) in upper GIT. Marketed dosage form needs repeated administration atleast 3 times a day to achieve therapeutic activity there by imposing unwanted side effects and this problem can also be avoided by FDDS3,4.
The focal objective of the current study was to prepare an effervescent floating drug delivery system with extended release, which increases the bioavailability, patient compliance, and will diminish the administration frequency. In this study, Domperidone and Famotidine combination (DFC), tablets with effervescent floating were developed and optimized by Quality by Design (QbD) implementation. QbD is a tool in which the development of formulations will be carried out by risk assessment, construction of design space withinbuilt quality, and exhibits flexibility as per regulatory guidelines5. The experiments were deliberated by the implementation of Design Expert 11 software. In preliminaries, the Quality Target Product Profile (QTPP) was defined, and Critical Quality Attributes (CQA's) were investigated. Risk assessments were made to select the critical variable in formulation development. A Full Factorial design was selected to design the experiment (DoE) and thereby assessing continuous improvement for maintaining quality6.
Materials
Domperidone was acquired from Vector biosciences PVT Ltd, Hyderabad and Famotidine from Divis laboratory as gift samples. Excipients used were HPMC K100, Carbopol 934P, Ethylcellulose, Sodium bicarbonate, Magnesium stearate, Talc, and Lactose purchased from SD fine chemicals, Mumbai.
Methods
Quality by Design (QbD) implementation
Quality Target Product Profile (QTPP) of the proposed drug delivery system
QTPP is a needed document that enables the formalization and tracing of the evolution of the knowledge acquired throughout the drug lifespan. Based upon the Reference Listed Drug (RLD), requirements and targets were set up for QTPP7).
Critical Quality Attributes (CQA's) of proposed drug delivery system
Relevant CQAs can be known by a frequent process of quality risk management and experimentation which assesses the quality of the drug product.
Risk Assessment by using QTPPs and CQAs
A risk assessment of the drug substances attributes was made to assess the impact of each attribute on the drug product CQAs.
Design of Experiment (DoE)
DoE is a prevailing skillful experiment, conducted in randomized order. The number of experiments required depends upon the selected design which curtails the number of trials. Optimization was executed by two-level, three-factor (23) full factorial design using Design Expert 11 software. Independent variables (HPMC K100M, Carbopol 934P, and Ethylcellulose (EC)) and dependent variables (Floating time, percentage cumulative drug release at 2 h, 12 h, and t50%) were selected for optimization based on risk assessment of data8.
Drug-excipient interaction compatibility studies
An FT-IR spectrum was recorded by the KBr pelletization method (FT-IR Bruker model). 2 mg of the pure drug(s) (Domperidone, Famotidine) were dispersed in Potassium bromide powder (KBr) and by pressurizing 6 tons the pellets were prepared and scanned separately. Individually the spectra were compared for validation of common peaks. The same procedure was adopted for FTIR study of drug(s) with excipients
5 mg drugs (pure) and drug(s) with excipients were placed into DSC aluminum pan (DSC-60, Shimadzu) separately and then scanned at the temperature range of 25-2900C of heating increment of 15 0C/min, then the obtained thermographs of the drug(s) (pure) and with excipients was equaled for interaction9.
Preparation of Domperidone and Famotidine Effervescent Floating tablets
All the ingredients were collected and weighed precisely. In addition to the previously formulated APIs and Carbopol mixture, the geometric mixture of HPMC K100, Ethyl cellulose (EC), sodium bicarbonate, and filler was added and mixed well along with Talc (2%) and magnesium stearate (1%) then passed through the 60# sieve. The lubricated mixture was compressed using round tooling on Rimex-I rotary tablet machine.
Design Space
In terms of ranges of material attributes and process parameters, Design space was defined. The linear formula is as given below10.
Y = b0+ b1X1.+ b2X2+b3X3+b4X4+…………..bnXn
Where Y is considered as a response, b0 is the constant, b1 b2 …….bn is the variables X1 X2........Xn is representing the effect every ordered between -1 and +1.
Control strategy
The parameters and attributes were included in control strategy such as drug type, pharmaceutical materials, and components, operating conditions of facilities and equipment, in-process controls, specifications of finished products, allied methods11.
Physical characterization of floating tablets
The tablets were screened for organoleptic characters, hardness (using monsanto hardness tester), thickness (using digital vernier calipers), % friability (25 rpm in roche friabilator), weight variation. Content uniformity was determined by randomly collecting twenty tablets and by crumbling in mortar and pestle. Then the requisite quantity of the drug(s) were transferred into a 100 ml volumetric flask. To this, 0.1 N HCl was added, followed by mechanical shaking for 5 min and filtration. Several dilutions were made and finally, 10ml/µg was evaluated to determine the drug content at 284 nm (Domperidone), 260 nm (Famotidine) by UV-Visible spectrophotometer simultaneous estimation method12,13.
In vitro Floating studies
The test was performed using USP Type-II apparatus paddle using 900 ml of 0.1N Hydrochloric acid (HCl) as a dissolution medium at 75 rpm at 37°C ± 0.5°C . The time taken for a tablet to float on the medium surface was noted which was considered as floating lag time. The time duration of the tablet to float constantly on the medium was considered as floating time.
In vitro Dissolution studies
USP Type-II (Paddle) apparatus, 0.1 N Hydrochloric acid (HCl) as a dissolution medium at 75 rpm at 37°C ± 0.5°C were the maintained parameters. At the regular time intervals (1, 2, 3, 4, 5, 6, 8, 12) h, the samples were withdrawn by using a syringe fixed with a pre-filter and replaced with fresh 0.1 N Hydrochloric acid (HCl) media. Cumulative percentage drug release was analyzed at 284 nm (Domperidone) and 260nm (Famotidine) by the developed HPLC technique14.
Statistical data optimization and analysis
The obtained formulations data were scrutinized by Design expert 11 software to generate study design.
Half normal plots, Pareto chart, and ANOVA data were used to identify and to select a significant factor that affects the formulation development. Design space was created by model graphs, their interactions, contour plots, 3D surface response plots, and overlay plots.
Analytical development for dissolution samples (HPLC)
Standard and blank solution preparation
The standard solution was prepared by dissolving the drug(s) Domperidone (20mg) and Famotidine (20mg) in a buffer (15ml) and acetonitrile (10ml) and transferred into a 25 ml volumetric flask and sonicated for 5min, then filtered through 0.45µm membrane filter. The concentration of the solution was found to be 1.6mg/ml. The blank solution which was used as the mobile phase was prepared as similar to standard without the pure drug(s) in the ratio of 60:40% v/v mixtures of Phosphate buffer and acetonitrile15.
Sample preparation
The collected dissolution samples equal to 10mg of Domperidone and 20mg of Famotidine were transferred to a 25 ml volumetric flask. The sample was dissolved and diluted with the mobile phase and subjected to sonication for 10min, filtered through a 0.45µm membrane filter.
Chromatographic Conditions: The HPLC separation and quantification were carried out using a stationary phase composed of Analytical column-Phenomonex-Gemini, C- 18 (250x4.6mm id,5μ). The mobile phase composed of potassium dihydrogen phosphate buffer-acetonitrile-methanol (40:40:20) was pumped at a flow rate of 1ml per min, and the run time was 7 minutes. The mobile phase was filtered through a 0.45μm membrane filter and degassed using an ultrasonic bath. The system was equilibrated and saturated with the mobile phase for half an hour before the injection of the solutions. All determinations were carried out at room temperature. The absorbance was measured at 284nm and 260nm. 20µL was the Injection volume. The peak areas were taken to quantitatively determine the amount of drug(s) present in the sample. Further based on the amount of drug(s) %, cumulative % drug release was calculated16.
Stability studies
Tablets of the optimized formulation were filled in HDPE containers to carry out stability studies at 40° C ±2°C /75% ± 5% RH for 3 months. The optimized formulation was evaluated for hardness, floating lag time, drug content and in vitro drug release studies after 3 months.
In vivo Study protocol
Ethical clearance
The study was performed after obtaining approval from the Institutional Animal Ethics Committee (IAEC). A total of 6 rabbits were considered and from that 2 were used for in vivo floating behavior and 4 were used for pharmacokinetic studies.
In vivo floating behavior
In vivo floating behavior of optimized floating formulations was studied in healthy rabbits, weighing 1.5 - 2.5 kg. The study was conducted with the prior approval of the Institutional Animal Ethical Committee. The study is constructed on the principle of monitoring radiological activity. Animals are housed individually in polypropylene cages and maintained under standard conditions. A total of 2 rabbitsTotal 2 rabbits were involved in the study. The rabbits were fasted for 12h before initiating the study. First, an X-ray was taken from the rabbits to ensure the absence of radio-opaque material in the stomach. During the study, animals were not allowed for food but the water was provided ad libitum. Radiopaque formulations were prepared by incorporating 500 mg of barium sulfate into the optimized formulation. At varying time intervals, X-ray photographs of the gastric region were taken for monitoring the floating behavior of formulations17.
Experimental design
Four healthy rabbits with a bodyweight range of 1.5-2.5 kg were selected through physical examination. An open label, balanced, randomized, Two-period, Two-treatment, Two -sequence, single-dose crossover study design in which four healthy rabbits received one treatment (product) each with a washout period of 7 days such that all products are tested in all the four healthy rabbits during the study18. Each healthy rabbit receive the following treatment in random order given in (Table 1)
Table 1: Two-way crossover treatment study for the selected optimized formulations
| Animal | Sequence 1 | Washout | Sequence 2 |
| Animal 1 | Optimized tablet | Marketed formulation | |
| Animal 2 | Marketed formulation | Optimized tablets | |
| Sequence 1 | Washout | Sequence 2 | |
| Animal 3 | Optimized tablet | Marketed formulation | |
| Animal 4 | Marketed formulation | Optimized tablets |
Drug administration
The animals were fasted overnight before administering the dose. After collecting the zero hour blood sample (blank), a standardized diet was given. The healthy rabbits were fixed in an individual rabbit holder with its head protruding outside. Then a mouth gag was introduced in between the two jaws and held in position by holding the upper jaw and lower jaw with a left hand and fixed formulations were administered through the oral route with the help of a pet piller. An I.V. cannula, 20-G KitKath (Hindustan Syringes &Medical Devices, Faridabad, India) was inserted into one marginal ear vein for blood collection before drug administration19.
Blood sample collection
During each period, 0.5 ml venous blood samples were collected from the marginal ear veins of each rabbit in AcCuvet tubes (Quantum Biologicals Pvt. Ltd., Chennai, India) containing K3EDTA. Blood Samples were collected at predetermined time intervals of 0, 0.50, 1.00, 1.50, 2.00, 2.50, 3.00, 4.00, 6.00, 8.00, 12.00 and 24.00 h (11 intervals). The collected plasma was immediately separated by centrifugation at 7500 rpm for 15 min from the blood samples and stored in frozen conditions at -20°C before analysis. The concentration of each drug in rabbit plasma samples was measured by the HPLC method.
Determination of pharmacokinetic parameters
Pharmacokinetic parameters such as peak plasma concentration (Cmax), time at which Cmax occurred (Tmax), area under the curve (AUC), elimination rate constant (Kel), biological half-life (t½), absorption rate constant (Ka) and mean residence time (MRT) were calculated in each case using the data by KineticaTM 2000 software (Inna Phase Corporation, U.S.A) using non-compartmental approach20.
Results
QbD (Quality by Design) implementation and optimization
QTPP was carried out on Domperidone and Famotidine combination drug for the preparation of the desired formulation, needed in the final product. It was demonstrated in (Table 2).
Table 2: Quality Target Product Profile (QTPP) of Proposed Drug Delivery System
| QTPP | Target | Requirement |
|---|---|---|
| Dosage Form | Extended release Floating Tablets | To reduce the gastric emptying and to enhance the oral bioavailability |
| Route of administration | Oral | Same route of administration |
| Dosage strength | 10mg & 20mg | Pharmaceutical equivalence requirement: same strength |
| Weight of the dosage form | Not more than 400mg | Patient Compliance |
| Stability study | The Product should be stable for 24 months | To establish the shelf life of drug products. |
| Hardness in case of floating tablets | Not less than 4kP | Hardness impacts dissolution. |
| Floating lag time | Should be within 15 minutes | Required as a part of the ideal characteristics of FDDS |
| Floating time | Should be floated in an acidic environment for at least 12 hours or more than 12 hours | Ideal for FDDS |
| Dissolution | USP Apparatus -II (Paddle) Media: 0.1 N HCl RPM: 75 Volume 900 mL Time Points: 0.25, 0.5, 1, 2, 4, 6, 8, 10 and 12 h | Extended release with First-order for a minimum of 12 hours is expected for an FDDS to improve the bioavailability |
| Assay | 95.0% to 105.0% for both the drugs | Needed for clinical effectiveness. |
| Pharmacokinetics | Cmax: Within 2 hours Maximum Residence Time should be higher than marketed drug Bioavailability: Should be higher than marketed drug | Objective is to increase the bioavailability of both the drugs |
CQAs were identified based on the safety and efficacy of the formulation and elaborated in (Table 3).
Table 3: Critical Quality Attributes (CQAs) of a Proposed Drug product
| Drug product | Target | Is a CQAs | Level of risk | Justification |
|---|---|---|---|---|
| Hardness in case of floating tablets | Not less than 4kP | No | NA | Hardness impacts dissolution. However, it will be extended during compression. |
| Identification Test | HPLC: Retention time of the principal peak in the chromatogram should be equal to the same as that of the standard solution in the estimation of related substances. | Yes | Low | Though identification was critical for safety and efficacy, this CQA can be effectively extended by the quality management system and will be monitored at drug product release. Formulation and process variables do not impact identity. Therefore, this CQA will not be discussed during formulation and process development |
| Floating lag time | Should be floated within 15 minutes | Yes | Medium | Required as a part of ideal characteristics of floating drug delivery system |
| Floating time | Should be floated in an acidic environment for at least 12 hours | Yes | High | Ideal for floating drug delivery system |
| Dissolution | USP Apparatus -II (Paddle) Media: 0.1 N HCl RPM: 75 Volume 900mL Time Points: 0.25, 0.5, 1, 2, 4, 6, 8, 10 and 12 Hours | Yes | High | Failure to meet the dissolution specification can impact bioavailability. Both formulation and process variables affect the dissolution profile. This CQA will be investigated throughout the formulation and process development |
| Assay | 95.0% to 105.0% for both the drugs | Yes | High | Assay variability will affect safety and efficacy. Process variables may affect the assay of the drug product. Thus, the assay will be evaluated throughout product and process development. |
After preliminary trials and from the risk assessment, initially, HPMC K 100M, Carbopol 934P, Ethylcellulose (EC) were selected as independent variables to study their effect on dependent variables. Hence 23 Full factorial design was selected for the present study, it was set at two levels three factors with four midpoints. From the four midpoints the average was considered. (Formulations were 8, and average mid-point was 1, and a total of 9 formulations were performed). Risk assessment was demonstrated in (Table 4) and (Table 5).
Table 4: Risk assessment for formulation variables
| Drug product CQA | HPMCK100 | Carbopol 934P | Ethyl Cellulose |
|---|---|---|---|
| Assay | Low | Low | Low |
| Hardness | High | High | High |
| Floating time | High | High | High |
| Dissolution | High | High | High |
Table 5: Justification for risk assessment for formulation development
| Formulation variables | CQAs | Justification |
|---|---|---|
| Polymers Levels | Assay Hardness Floating time Dissolution | Extended-release of the drug from tablet depends upon proper hardness which directly affects the drug release. Efficient floating effective release. Hence the risk was high. |
| Talc level | Assay Hardness Floating time Dissolution | The presence of talc at a low level may not affect assay, drug release. Hence the risk was low. |
| Magnesium stearate Level | Assay Hardness Floating time Dissolution | A Low amount of the lubricant diminishes the effect and hence low risk. |
Design of Experiment (DoE)
In Design of Experiment (DoE), Y1 was floating time, Y2 was drug release at 2 h, Y3 was drug release at 12 h, and Y4 was time taken to release 50% drug were considered as dependent variables and Independent variables were X1 (HPMC K 100), X2 (Carbopol 934P), X3 ( Ethyl Cellulose)
Drug-excipient interaction compatibility studies
FTIR of the pure drug and pure drug with excipients showed that there was no incompatibility with excipients used and were found to be compatible.
DSC thermographs showed the melting point of pure drug Domperidone at 251.90C and with excipients at 260.80C. The melting point of the pure drug Famotidine was observed at 168.690C and with excipients at 179.590C. By this, it was proved that there were no major shifts and indicated that no, physical and chemical interactions.
Physical characterization of floating tablets
Organoleptic characteristics showed that both the drugs (Domperidone and Famotidine) were white color and odorless. Formulations (F1-F9) were prepared and pre-compression parameters indicated that the prepared blend had good free-flowing property. Compressibility index (CI), Hausner's ratio, and angle of repose were found to be in the range showed in (Table 6). Tablets were evaluated for Post compression parameters which were complied with acceptable variation as per IP specifications. The tablet thickness was found to be 4.12 to 4.15 mm and hardness was found to be 5.39 to 5.89 kg/cm2, the friability values of all the formulations were less than 1% as per IP limits. The percentage of drug in the developed tablets was found to be 93.5 to 100.3 of Domperidone and 95.4 to 100.3 of Famotidine.
In vitro floating studies
All the selected optimized formulation tablets were placed in 0.1N HCl dissolution medium separately (n=9) and the floating lag time of all tablets was found to be 5 to 12 mins. Due to the presence of gas generating agent (Sodium bicarbonate) the effervescence was observed.
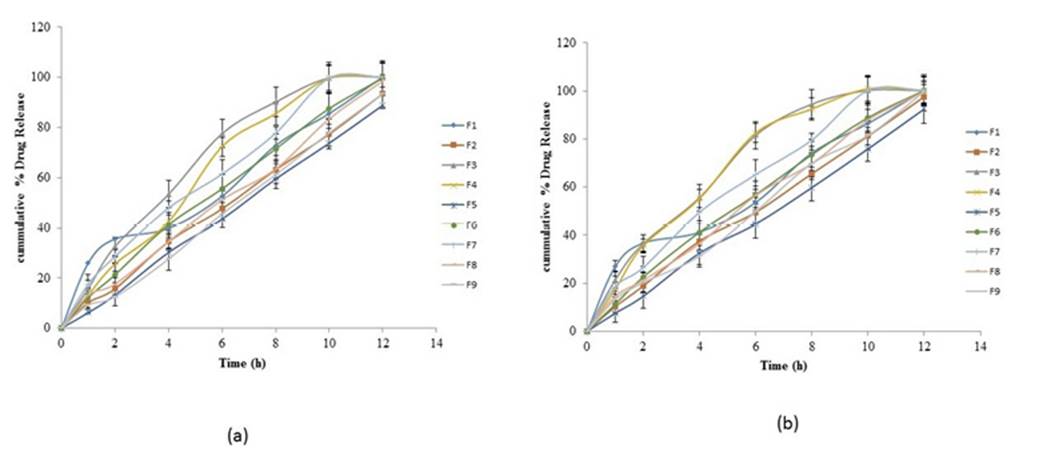
In vitro Dissolution studies
The formulations with a high concentration of carbopol 934P and low concentration of ethyl cellulose and HPMC K 100 exhibited extended release criteria i.e., NMT 20% release in 2 h and NLT 80% in 12 h. All formulations followed the first-order kinetics with Higuchi diffusion (r2=0.999) and fickian diffusion (n≤0.5). In vitro drug release of Domperidone and Famotidine is delineated in Figure 1
Discussion
Multiple regression analysis
Response (R1) analysis: Floating time (Y1)
Responses ranged from 5 min to 18 min and the ratio of maximum to a minimum is 3.6 that indicated no need for power transformation. The final equations of the reduced model contain only significant factor terms corresponding to the response analyzed.
Floating time (Y1) = 12.20 + 1.00 X1 + 1.01 X2 + 5.24X3 +0.81 X1X2 +0.66 X2X3
From the ANOVA results, it was found that the main factors affecting the floating time were X1, X2, X3, X1 X2, X2 X3. All factors had a synergistic effect. The adjusted F- value is 4.81 and the model p-value is 0.0119. The curvature term was removed to simplify the analysis. In the Fit Statistics section, the Predicted R² of 0.9789 is in reasonable agreement with the Adjusted R² of 0.9900. The Adequate precision ratio is 6.882 which was considered an adequate signal. Contour plots and 3D plot showed that, to maximize floating time (more than or up to 12 h) the concentrations of HPMC K100 (X1) and Carbopol 934P (X2) should be maintained at high levels i.e., 43.8mg (X1), 45.0mg (X2). At this concentrations, the floating time was 12.1 h. The perturbation plot showed that as As the concentration of HPMC K100, Carbopol 934P, and ethyl cellulose increased, the Floating time also increased. The Contour plot and the 3D plot is indicated in (Figure 2(a)) and (Figure 3(a))
Response (R2) Analysis: Drug release at 2 h (Y2)
Responses range from 10.5% to 39.7% and the ratio of maximum to a minimum is 3.78 that indicated no need for power transformation.
Drug release at 2 h (Y2) = 24.08 - 2.54 X1 + 1.37X2 - 6.34 X3 + 3.18X1X3 - 1.76 X2X3
From the ANOVA results, it was found that the major factors affecting drug release at 2 hwere X1, X2, X3, X1X3, X2 X3. Factors X1 and X3 exhibited a antagonistic effect while all other factors had a synergistic effect, The adjusted F- value was 5.01 and the model p-value was 0.0089. The lack of fit F-value of 275.96 implied that it was significant. In Fit Statistics section, the Predicted R² of 0.5272 is in reasonable agreement with the adjusted R² (0.3276). Adequate precision ratio was 7.436 indicating an adequate signal. Contour plots and 3D plot showed that in order to maintain drug release NMT 20%, HPMC K100M and ethylcellulose should be maintained at low levels and carbopol 934P should be maintained at high levels. By maintaining the concentrations of HPMC K100M, Carbopol 934P and Ethylcellulose at 45mg (X1), 45mg (X2) and 15mg (X3) then the drug release was NMT 20%. The perturbation plot showed that an increase in the concentration of HPMC K100M and ethylcellulose led to decrease in drug release and an increase in the concentration of carbopol 934P resulted to increase in drug released. Contour plot and 3D plot is indicated in (Figure 2(b)) and (Figure 3(b))
Response (R3) Analysis: Drug release at 12h (Y3)
Responses ranged from 86.4% to 101.3% and the ratio of maximum to a minimum is 1.17 that indicated no need for power transformation.
Drug release at 12 h (Y3) = 97.53 + 1.14 X1 + 1.63 X2 -1.94 X3 - 1.04 X1X2 + 1.98 X1X3+ 0.8813 X2 X3
From the ANOVA results, it was found that the major factors affecting the Drug release at 12 h were X1, X2, X3, X1X2, X1 X3, X2 X3. Factor X3 exhibited an antagonistic effect while the remaining factors had a synergistic effect. The Adjusted F- value was 4.33 and the model p-value was 0.0218. The Lack of Fit F-value of 3.43 implies that it was significant. In the Fit Statistics, the Predicted R² of 0.9361 is in reasonable covenant with the Adjusted R² of 0.9610. The Adequate Precision ratio was 4.548 indicatingan adequate signal. Contour plots, 3D plot have shown that to maintain drug release NLT 80% Ethylcellulose should be maintained at low levels and HPMC K100M and Carbopol 934P should be maintained at high levels. By maintaining the concentrations of HPMC K100M, Carbopol 934P, and Ethylcellulose at 45mg (X1), 45.0mg (X2), 15mg (X3) then the drug release is NLT 80%. The perturbation plot shows that as an increase in the concentration of ethylcellulose the drug release is decreased and an increase in the concentration of HPMC K100M and Carbopol 934P the drug release also increased. The Contour plot and 3D plot are indicated in (Figure 2(c)) and (Figure 3(c)).
Response (R4) Analysis: Time taken to release 50 % drug (Y4)
Responses range from 3.8 h to 7 h and the ratio of maximum to a minimum is 1.84 that indicates no need for power transformation.
Drug release at 12 h (Y4) = 5.34 + 0.3750 X1 - 0.4750 X2 + 0.2125 X3 + 0.0375 X1X2 + 0.1500 X1X3+ 0.5500 X2X3
From the ANOVA results, it was found that the major factors affecting the floating time were X1, X2, X3, X1X2, X1 X3, and X2 X3. Factor X2 had an antagonistic effect while the other factors had a synergistic effect. The adjusted F- value is 14.57 and the model p-value was less than 0.0001. The Lack of Fit F-value 10.55 implicates that Lack of Fit is significant. In Fit Statistics, the Predicted R² of 0.6318 is an injudicious agreement with the Adjusted R² of 0.8190 i.e. the difference is less than 0.2. This indicated there was no large block effect on the model so no need for model reduction and response transformation. The Adequate Precision ratio was 11.350 indicated an adequate signal. Contour plots, 3D plot showed that to maintain extended drug release (50%) HPMC K100M and Ethylcellulose should be maintained at high levels and Carbopol 934P should be maintained at low levels. By maintaining the concentrations of HPMC K100M, Carbopol 934P and Ethylcellulose at 43mg (X1), 44.8mg (X2), 15mg (X3) then the drug release (50%) was achieved at 5.6 h. As perturbation plot showed that as an increase in the concentration of HPMC K100M and Ethylcellulose the drug release increased and an increase in the concentration of Carbopol 934P the drug release also decreased. Contour plot and the 3D plot is indicated in (Figure 2(d)) and (Figure 3(d))

From all the responses, the ANOVAresults exhibited significance hence were selected for further analysis. The model was used to navigate the design space. All factor graphs and interaction graphs showed LSD bars around the predicted mean, which were good quick pair wise comparisons. From the Half-normal plot and Pareto Chart, significant factors were identified i.e., above t-value. The normal probability plot residuals followed a normal distribution i.e., followed a straight line as shown in (Figure 4).

Figure 3: 3D surface response plots of (a) Response (R1), (b) Response (R2), (c) Response (R3), (d) Response (R4) all four responses.

It was evident from the plots of Residuals versus Predicted, Residuals Versus Run that error terms were not associated with one another and it adequately showed that the model fits the data obtained from Software. Predicted Versus Actual plot data points exhibited a split by the 45-degree line indicated significance. Cook's distance provides valuable information regarding the measurement of regression effect changes if the case is deleted, large values should be identified which were produced by recording errors and should be corrected. In this case, no large values were observed it indicated the data without any errors. All were shown in (Figure 5).

Figure 5: Plots exhibiting significance at p <0.05 (a) Normal plot (b) Residual versus Run (c) Box-Cox plot (d) Cook's distance
To optimize all responses with different targets, a multi-criteria decision approach like a numerical optimization technique by desirability function and graphical optimization technique by the overlay plot were used and represented in (Figure 6). The optimized results gave a solution with theoretical target profile characteristics which were shown in (Table 7) relative errors (%) between the predicted and experimental values for each response were calculated and values were found to be within 1.018. the experimental values were in agreement with the predicted value confirming the predictability and validity of the model.
Table 7: Comparison of experimental results with predicted responses of Domperidone and Famotidine
| Ingredient | Composition (mg/tab) | Response | Predicted value | Experimental value | Standard error |
|---|---|---|---|---|---|
| HPMC K100 | 45 | Y1 h | 12.24 | 11.51 | 0.365 |
| Carbopol 934P | 45 | Y2 % | 23.47 | 24.89 | 0.71 |
| EC | 15 | Y3 % | 97.6 | 98.1 | 0.25 |
| Y4 h | 5.3 | 5.9 | 0.3 |

In vivo studies
In vivo Buoyancy Studies
The X-ray images were taken after administration of barium sulfate loaded optimized floating tablets to the rabbits under fasting conditions. (Figure 7) shows X-ray images at different time intervals i.e, 0h, 6h, and 12h in the rabbit. It was observed that the tablet remained in the gastric region for more than 12h.

Pharmacokinetic assessment
The mean plasma concentration of the Domperidone and Famotidine both test and reference in (Table 8). (Figure 8) shows the comparative plasma profiles of Famcool-D Marketed formulation (R) with Domperidone and Famotidine. The mean peak plasma concentration (Cmax) of the test (T) formulation was less when compared with the reference (R) formulation. The increase in tmax clearly indicated the drug availability for a prolonged period. After reaching the tmax the drug started elimination and plasma concentration gradually decreased. In the case of the test (T) formulation, the tmax achieved slowly and the drug availability was found for a long time. The increase in AUC0-t was observed in the test (T) formulation, which was clearly indicated the drug availability for a long duration. The plasma elimination half-life (t1/2) of the reference (R) and the test (T) formulations were significantly different. Thus the prolonged t1/2 is another indication of the in vivo performance of the optimized floating tablets. The overall Cmax, tmax, AUCo-t, and t1/2 were completely different between both the test and reference formulation. Therefore the developed formulations released the drug for a prolonged period of time.
Table 8: Pharmacokinetic parameters of optimized tablets of Optimized formulation and Marketed product
| Parameter | Unit | Optimized Formulation | Marketed Formulation | ||
|---|---|---|---|---|---|
| Domperidone | Famotidine | Domperidone | Famotidine | ||
| Lambdaz | 1/h | 0.05 | 0.05 | 0.06 | 0.07 |
| t1/2 | H | 14.56 | 14.35 | 12.19 | 10.29 |
| tmax | H | 2.50 | 2.50 | 2.00 | 2.00 |
| Cmax | ng/ml | 43.40 | 85.16 | 45.60 | 89.46 |
| Clast_obs/Cmax | 0.09 | 0.09 | 0.13 | 0.08 | |
| AUC 0-t | ng/ml*h | 390.69 | 748.88 | 262.21 | 448.91 |
| AUC 0-inf_obs | ng/ml*h | 433.21 | 824.82 | 365.11 | 551.69 |
| AUC 0-t/0-inf_obs | 0.90 | 0.91 | 0.72 | 0.81 | |
| AUMC 0-inf_obs | ng/ml*h^2 | 4479.61 | 8282.15 | 6361.59 | 7057.20 |
| MRT 0-inf_obs | H | 23.45 | 23.57 | 17.42 | 12.79 |
| Vz/F_obs | (mg/kg)/(ng/ml) | 0.01 | 0.01 | 0.02 | 0.02 |
| Cl/F_obs | (mg/kg)/(ng/ml)/h | 0.00104 | 0.00 | 0.00123 | 0.00 |

Conclusion
floating tablets of Domperidone and Famotidine exhibited extended release for more than 12 h. The formulated and optimized tablets showed improvement in bioavailability where dosage frequency can be reduced with improved patient compliance. By the Risk assessment technique, the factors and responses that affect the quality of the product were assessed. 23 factorial design with midpoints could be successfully applied for the development of floating tablets with fewer trials and better quality attributes. The In vivo evaluation of the prepared floating tablets proved the improved bioavailability of drugs with increased plasma concentration more than 12 hours equal to that of commercial tablets that extended for 10 h. Hence, the amount of the drug and the number of administration per day were reduced. The further study can be extended to humans (clinical trials) to prove its side effects that could be predicted with this developed floating drug delivery system.

