


 Custom services
 English (pdf)
 Article in xml format
 Article references
 Send this article by e-mail
 Cited by SciELO
  Cited by Google
  Similars in
SciELO
Similars in
SciELO  Similars in Google
 Permalink
INTRODUCTION
High intense training programs and competitions are included in the routine of young athletes. The training’s objective involves getting good performance and, at the same time, health level is maintained at a good standard (Martínez, Pasquarelli, Romaguera, Arasa, Tauler & Aguiló, 2011). Different parameters, physical as anthropometrical, physiological, and biomechanical (Zamparo, Bonifazi, Faina, Milan, Sardella & Schena, 2005; Hue, Galy, Blonc & Hertogh, 2006) affect swim- ming performance. These parameters have been studied extensively in adults (Alberty, Sidney, Huot-Marchand, Dekerle, Bosquet & Gorce, 2006; Capelli, Pendergast & Termin, 1998; Hue, et al., 2006). Furthermore, the research dedicated to competitive swimming in young people is reduced in comparison with the one about adult/elite swimmers. Several parameters commonly assessed in adult swimmers cannot be used in young swimmers due to several reasons not only economical, but because ethical concern are generated when children are in evaluation situation (Barbosa, Costa, Marinho, Coelho, Moreira & Silva, 2010).
In swimming, most of the biomechanical studies have been carried out regarding the relationship between stroke rate (SR), stroke length (SL), and swimming speed (SS) (Poujade, Hautier & Rouard, 2002; Huot-Marchand, Nesi, Sidney, Alberty & Pelayo, 2005; Leblanc, Seifert, Baudry & Chollet, 2005). Coaches, in the training process (Maglischo, 2003), often use these parameters to control speed and how it is reached and kept, as SS is the product between SR and SL (Hay & Guimarães, 1983). As important as the relationship between SR and SL, is the stroke index (SI) – assessed multiplying swimming speed by stroke length – as an economy indicator, because it describes moving at a given speed with the fewest number of strokes (Costill, Kovaleski & Porter, 1985). The measure of these parameters is accepted as practical and reliable tools for determining training speed and evaluating the endurance capacity of young swimmers (Zarzeczny, Kuberski, Deska, Zarzeczna & Rydz, 2013). Critical speed (CS), assumed as the maximal swimming speed to be kept for a long time (Dekerle, Pelayo, Clipet, Depretz, Lefevre & Sidney, 2005) is an indicator of aerobic capacity. Toubekis, Tsami and Tokmakidis (2006) show high coefficients of correlation between different measures of CS and lactate concentration in young swimmers. Regarding young swimmers, Poujade et al. 2002 and Zamparo et al. 2000 studied children older than 12 years and determined the energy cost (C) during maximal 400-m front-crawl swimming. Poujade et al. (2002) found no significant correlation obtained between front-crawl C and anthropometric or stroking parameters. Zamparo et al. (2000) indicated a significant relation- ship between the front-crawl C at maximal voluntary speeds (50, 100, 200 and 400 m) and under- water torque.
Lactate concentration allows verifying the intensity of effort, the anaerobic and aerobic contributions and the training effects in swimmers (Keskinen, Keskinen & Mero 2007). Oliveira, Caputo, Lucas, Denadai and Greco 2012 observed that increases about 2.5% in swimming speed can result in changes in the lactate concentration, which may take to modify the intensity of the activity. Other parameter that could be used for monitoring the intensity is the heart rate, which can be used for a criterion for peak of oxygen consumption appointment. When is not posible to obtain the plateau of oxygen consumption, the peak of oxygen consumption is used for estimate this maximal intensity, and secondary criteria is through the heart rate (HR), which should be ≥ 90 percent of maximal cardiac capacity (Schnitzler, Ernwein & Chollet, 2007). Schnitzler, Seifert and Chollet (2011) observed that swimmers with better physical level present lower he- art rate when compared to swimmers with lower level. The rate of perceived exertion (RPE) is able to merge different parameters as physiological, cardiopulmonary and neuromuscular with the athlete experience, intensity and duration of the activity. RPE is influenced by the oxygen consumption, heart rate and lactate concentration, has low cost, it is non-invasive and fast for to determine the in- tensity of the exercise (Alberton, Antunes, Pinto, Tartaruga, Silva & Cadore 2011). RPE seems to be a suitable option to control water exercises intensity, being considered its application recommendations (Borg, 1982; Zamunér, Moreno, Camargo, Graetz, Rebelo & Tamburús 2011).
For young swimmers is an easy and effective tool to monitoring the training intensity. However, very few studies have investigated the importance of different physiological and kinematic parameters to study swimming performance in young swimmers. As the fundamental objective of a competitive swimmer is to travel the event distance as fast as possible. The aim of this study was to investigate kinematics and physiological parameters, in four maximal swimming tests. We hypothesized that older swimmers had better performance due to their experience in the sport, as well as anthropometric characteristics.
METHODS
Participants
Twelve competitive swimmers volunteered in this study. The swimmers were separated based on the 50th age: group 1 - percentile > 50th (G1, n = 6): 15.4 ± 0.81 years; 2 male/4 female; 56.9 ± 7.3 kg; 163 ± 0.08 cm; 174 ± 0.08 cm arm span; 17.8 ± 7.3% fat; approximately 40.000 m per week (6 times/week) and competition experience 6 ± 0.9 years; and group 2 - percentile < 50th (G2, n = 6): 12.1 ± 0.83 years; 1 male/5 female; 50.9 ± 5.8 kg; 157 ± 0.05 cm; 161 ± 0.04 cm arm span; 21.3 ± 8.7% fat; approximately 30.000 m per week (6 times/week) and competition experience 3.6 ± 0.8 years. Swimmers had at least 2 years of competitive experience, national and international, and trained normally during the data collection (6 ± 1 days) period (13 to 30 km of volume per week). all athletes of this age in the city of Paysandú, Uruguay participated in this study. The participants were divided according to their competitive categories and respecting the characteristics of their ages. All competitive swimmers between 11 and 16 years of age of the Paysandú city participated in this study.
This study was conducted in the first macrocycle (6 weeks) of the training season. All swimmers were in the base training period and performed 30 training sessions before the protocols. Swimmers were informed of the benefits and risks of the investigation before signing an institution- approved informed consent document to participate in the study. In addition, swimmers’ parents or guardians provided written consent.
The study was approved by the Ethics Committee of Universidad de la Republica, Centro Universitario Paysandú (Paysandú, Uruguay).
Measures
Kinematic parameters: data collection consisted of manual timekeeping and recording of external images in 50 m (T50), 100 m (T100), 200 m (T200) and 400 m (T400) all-out front crawl trials. For external recording, a two dimensions videogrammetry system was used in in the sagittal plane. The images were collected at a frequency of 60 Hz in the 25 m laps that preceded partials of 50 m, 100 m, 200 m, and 400 m.
The parameters were registered in a demarcated area in the swimming pool. The markers were placed in the same position for the two days of the protocol. Swimmers breathed for preferred side. Performance was determined by the time to cover each maximal test. Mean swimming speed (SS) was obtained by dividing the distance (10 m) and the time needed to go through it (in s).
The mean stroke rate (SR) was obtained by dividing four stroke cycles and the time needed to perform the four complete cycles. Mean stroke length (SL) was obtained by the ratio between SS and SL (Franken, Ludwig, Cardoso, Silveira & Castro 2016). The stroke index was obtained by multiplying the SS by the SL (Costill et al.,1985).
Physiological parameters: to measure blood lactate concentrations, blood drop samples were obtained from the left index finger after warm up and immediately after each maximal test. The concentration of lactate in these samples was determined using a commercial lactate analyzer (Roche 646). Heart rate (HR) was measured at ten different moments (described on design and procedures), on the carotid pulse with index finger and third finger by the same researcher. Rate of perceived exertion (RPE): we used the modified Borg scale (0 – 10). It is a 10 point scale with a non- linear scaling scheme using descriptive terms to anchor the responses from the participants.
Design and Procedures
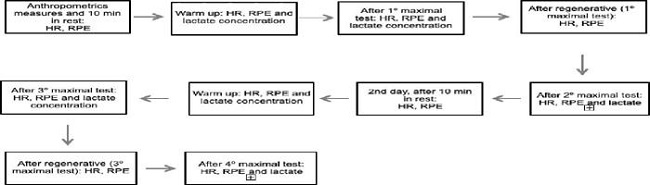
This cross-sectional study strictly followed the Reporting of Observational Studies in Epidemiology (STROBE) checklist (Von Elm, Altman, Egger, Pocock, Gøtzsche & Vandenbroucke, 2008). The first protocol (50 and 200m) and the second (100 and 400m) involved a randomized performance assessment in maximal front crawl stroke, with 6 days between each protocol. The test was conducted in a 25 m indoor pool (water temperature: 29.5 ± 0.7°C; air temperature: 24.2 ± 0.9 °C), between 09 and 11 am. Tests were carried out with start inside the pool and after a standard 800 m free swimming warm-up.
Initially, the physical parameters (body mass, height, arm span, % fat) were measured. The swimmers were asked to rest during ten minutes, to measure HR and RPE. We measured HR and RPE in the first day of protocol, at ten minutes after rest and after: (i) warm up for first day of protocol, (ii) first maximal test, (iii) 800 m regenerative, and (iv) after second maximal test. In the second day of protocol, HR and RPE were measured ten minutes after rest and after: (i) warm up , (ii) first maximal test, (iii) 800 m regenerative, and (iv) after second maximal test. After the warm up, and at each maximal test, the lactate concentration was measured as well. After the warm up the swimmers were required to perform the first maximal test (the maximal tests were randomized, for the first protocol day the tests were T50 and T200). When the swimmers finished the test, they swam 800 m in a regenerative intensity. After regenerative, and when HR and RPE were similar to the rest and stable, they performed the second maximal test. This sequence was the same for the two days of protocol. Figure 1 shows a scheme of the temporal organization of the protocol used.
Statistical Analysis
All values are expressed as mean ±SE. Anthropometric characteristics comparisons between groups were carried out by unpaired t-test. Kinematics data and HR, RPE, lactate concentration data were compared with repeated measures ANOVA. When appropriate, multiple comparisons were made with the Bonferroni correction. Relationship between lactate concentration and time of each maximum test, stroke index and swimming speed for each maximum test were assessed using Pear- son correlation coefficients. The proposed statistic has sufficient robustness for the data evaluated Alpha was stablished at 0.05 and all analyses were carried out on SPSS.
RESULTS
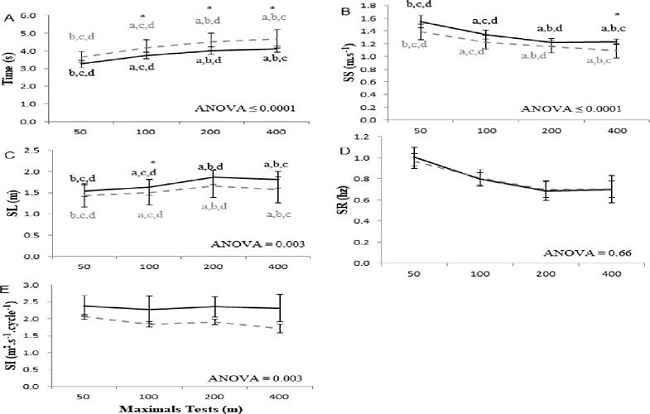
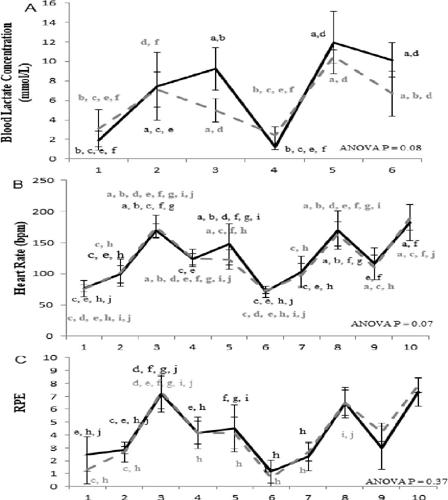
There was no difference regarding anthropometric characteristics between groups. In kinematics parameters, as expected, the time (P ≤ 0.0001) and SR (P = 0.002) were higher in G2. SS (P ≤ 0.0001) and SL (P = 0.003) were higher for G1. No differences between groups for [La], HR and RPE were found. The [La] after warm up in two protocols were lower than measured after maximal tests for both groups. The HR was lower after rest, warm up and after regenerative than after maximal tests for G1. In T100 and T400 the G2 shows higher HR after the regenerative than measured in the rest. The RPE presented same values in rest, after warm up and after regenerative for both groups.
The correlational analysis (Table 1) revealed a strong correlation between [La] and performance in T100 for both groups, and for [La] and T50 for G1. There were no difference and correlation between [La] and T200 and T400 (both groups), and 50 m maximal tests (only for G2). Swimming speed and SI show strong correlation in all tests for G2 and in T50 and T100 for G1 (Table 1) Pearson's correlation between lactate concentration and performance of each maximal tests: performance for 50m is p50, performance for 100m is p100, performance for 200 m is p200, performance for 400m is p400; G1= group one percentile > 50th , G2 = group two percentile < 50th; [La] = blood lactate concentration; SI - stroke index for each maximals tests. r = Pearson's correlation test; P= statistical result.
Table 1. Pearson's correlation between lactate.
| G1 | G2 | |||
|---|---|---|---|---|
| r | P | r | P | |
| [La] vs p50 | −0,56 | 0.05 | 0.25 | 0.47 |
| [La] vs p100 | 0.66 | 0.05 | 0.25 | 0.47 |
| [La] vs p200 | 0,27 | 0.01 | 0.77 | 0.03 |
| [La] vs p400 | 0.31 | 0.31 | −0,39 | 0.17 |
| SI vs p50 | 0.71 | 0.05 | 0,85 | 0.05 |
| SI vs p100 | 0.92 | 0.03 | 0,94 | 0.02 |
| SI vs p200 | 0.74 | 0.02 | 0,87 | 0.04 |
| SI vs p400 | 0.61 | 0.05 | 0,8 | 0.03 |
DISCUSSION
We found differences between groups in performance (T100, T200 and T400), SS (T400), SL (T100) and SI(T50, T100, T200 and T400). A possible explanation about this result can be the experience of G1 group, as we did not find any differences between groups for the anthropometric characteristics. Knowing the characteristics by age makes it possible to target training to specific weaknesses as age progresses. The anthropometric characteristics were similar to others studies with young competitive swimmers and general athletes (Martínez 2011; Baxter-Jones, Helms, Maffulli, Baines-Preece & Preece, 1995). When anthropometric characteristics of young athletes are compared with other sports, swimmers were significantly heavier than gymnasts were at all ages. At 14 years old, swimmers had significantly less body fat than tennis players (Baxter-Jones, et al., 1995). When compared to elite adolescent runners, the junior Olympic swimmers (15 – 18 years old) of both sex had larger total body and fat mass, and relative fat levels. Differences between junior Olympic swimmers and adolescent non-athletes were also noted with the former group tending to be taller, heavier and lean body weight (Thorland, Johnson, Housh & Refsell, 1983).
For the kinematics parameters, the G1 presents a better performance when compared with G2. They presented higher SS, SL, SI, and better performance in seconds for each test than G2. Kinematic parameters of the G1 were higher even without anthropometric differences. According to Craig and Pendergast (1979), the ability to achieve a high SS is directly related to an increase in SL. Literature suggested SL to be an important indicator of propelling efficiency, demonstrating the quality of the technique used in swimming, which may be used to evaluate the progress in "techni- cal ability" (Maglischo, 2003). The lower performance for G2, and the difference in kinematics parameters were expected because there is a variation in the biological or physical ages of the children in the same chronological age and lower technical level. Likewise, we did not find differences for anthropometrics characteristics, which could justify these results.
Lätt, Jürimäe, Haljaste, Cicchella, Purge and Jürimäe (2009) found that SI was the best kinematic predictor of 400 m front crawl performance. We found a strong and significant association between SI and swimming speed at all tests. This kinematic parameter can help coaches during training for improvement in swimming performance during the period of physical maturing. In a longitudinal study with young swimmers, the improvement in swimming performance was related to the increase in body height and upper arm span values, improvement in peak of oxygen consumption and SI. The kinematic parameter characterized best 400 m front crawl performance in young swimmers, followed the physical and physiological parameters. These results show the importance on learning the correct swimming techniques during the early years of training.
There were no differences in blood lactate concentration, heart rate and rate of perceived exertion between groups. The differences were only for the measure for different moments along the protocols, which show that athletes performed the maximal intensities requested for each group. The [La] were above 8 mmol.l−1 for G1 at 100, 200 and 400m tests, which indicates as secondary criteria for to achieve the maximum oxygen consumption. Small increments in swimming speed can result in large increase in [La], which occurred with G1 (Oliveira et al., 2012). For G2 this value just has achieved more than 8 mmol.l−1 at 100m test.
Children (11 - 13 years old) may consume more energy from aerobic metabolism even at a racing pace (Takahashi, Bone, Spry, Trappe & Troup, 1992), and is necessary very high exercise intensity (than corresponding in adults) for the purpose of to elevate the [La] above than 4 mmol.l−1 (Williams & Eston 1989). Although we have not measured oxygen consumption in this study, it seems interesting to discuss secondary criteria for maximal oxygen consumption, exercise intensity and lactate concentration in children: whereas in children, especially those who have not yet entered the period of puberty, lactate concentrations rise little in response to exertion, the 8 mmol.l−1 criterion, secondary to assuming maximal oxygen consumption values, seems to be inadequate. In previous study, a considerable number of children may not even achieve 4 mmol.l−1, but they achieve considered peak of oxygen consumption (Williams & Eston 1989). The improvement of adapted metabolic sport training depends on the appropriate increase of required energy. It appears therefore that other energy fuels are needed to sustain muscle activities during sport and young people do not have preferential metabolic pathways (Calfee & Fadale 2006). The training improves the capacity to support higher intensities with predominate of aerobic metabolism (Wakayoshi, Yoshida, Udo, Harada, Moritani & Mutoh, 1993), but present singular characteristics for young athletes how our results demonstrated.
Regarding young swimmers, there are few articles evaluating blood lactate concentration, which evaluate energetic state, physiological capacity, and swimming performance. This is despite the fact that aerobic and anaerobic power, and skill acquisition are affected by growth and development (Malina, 1994). That factors predicting swimming performance may vary for young swimmers during their physical maturing. In this study, for both groups there are not strong association and significant differences between [La] and T50, T200 and T400 performances. It may represent the chose for aerobic metabolism like a principal metabolic pathway for this group. Young swimmers show higher values of aerobic power when compared with untrained children, and the aerobic power increased in puberty (Baxter-Jones 1995; Lätt, et al., 2009). Zamparo et al., (2000) found an in- creased in the power output of the aerobic energy sources and decreased in anaerobic energy sources for maximal voluntary speeds for young swimmers – 12-17 years old. For coaches it is interesting to examine the utilization of these anthropometric, mechanics and physiological parameters on the performance and efficiency swimming. The main objetive is the prediction of performance like in young swimming athletes. The SI is considered as a valid indicator of swimming efficiency in adults (Costill et al.,1985) and children (Jürimäe et al., 2007). The HR is one more used for intensity control, but in aquatic environment occur a decrease about 9 – 13 beats per minute. A secondary criteria for to estimate the peak of oxygen consumption is the HR, which should be ≥ 90 percent of maximal cardiac capacity, to be considered to have reached peak of oxygen consumption (Schnitzler et al., 2007).
For our groups, the maximal HR estimated with Tanaka, Monahan and Seals (2001) equation shows a HR expected for peak of oxygen consumption only for T400 for both groups. If one considers the de- crease in HR caused by the aquatic environment, the peak of oxygen consumption was achieved at T100 and T200 for both groups. The RPE was different for values at different intensities, which was measured. These results show that RPE is a good tool for to evaluate the efforts on swimming. Franken, Diefenthaeler, Moré, Silveira & Castro (2013) observed maximal intensity in 200 and 400m evaluating the critical speed, HR and RPE, and conclude that RPE can be used for to determine the intensity of the exercise. The RPE is influenced by the HR, [La] and peak of oxygen consumption, and it integrates all parameters analyzed in our study. So, RPE can be assumed as good instrument with low cost for daily practice. The swimming practice improves the cardiovascular function since the acute exercise parameters, as intensity, are under control (Maglischo, 2003). Besides that, for young swimmers the mo- tor activity can affect, or even accelerate, the learning process of preschool-aged children (Lubomíra and Matúš, 2017). Thus, coaches indicate the SI to assess their performance and the complete development of their swimming technique. For the RPE, coaches use as an incentive to know the physical, physiological and emotional capacities when it comes to tasting young athletes.
CONCLUSION
Aquatic competition is acquired as a result of gradual and regular changes. The results show differences for kinematics parameters between the two groups of young swimmers in maximal swimming tests. There are no differences at anthropometric characteristics, it is very important so the age and individual capacities is essential to prescribe swimming training according to the needs and goals. SI and perceived exertion seem to be good, easy and economic parameter to evaluate and to monitor young swimmers during the training.

