


 Servicios personalizados
 Inglés (pdf)
 Articulo en XML
 Referencias del artículo
 Enviar articulo por email
 Citado por SciELO
  Citado por Google
  Similares en
SciELO
Similares en
SciELO  Similares en Google
 Permalink
Introduction
Overweight (OW) and obesity (O) are metabolic risk factors for development of type 2 diabetes mellitus (T2DM). In Mexico OW and O occur in 75.2% of population over 20 years of age, with a higher prevalence rate in females than males (1), this problem is exacerbated by low levels of physical activity (2).
One of the best predictors for development of T2DM is insulin resistance (IR), characterized by the fact that different cells or tissues of a person decrease their ability to respond to the action of the hormone (3). It has been established an association between O and IR, for decades; a phenomenon with both scientific and clinical implications (4).
Estimation of IR is of great importance in people with some risk factors for developing T2DM (5). Hyperinsulinemic-euglycemic clamp is considered the gold standard for its determination, however, its complexity, application time and cost are disadvantages for its use in epidemiological studies, for which other methods are used, including the HOMA index (Homeostasis Model Assessment) and the QUICKI index as the most used (6).
HOMA index identifies the fasting insulin/glucose ratio. This method has been a clinical alternative for the diagnosis of IR (7,8). However, in recent years, a technique that determines the fasting triglycerides/glucose ratio (TyG) has been reported with a high sensitivity to estimate IR (9).
Studies have been carried out in both Brazilian (10) and Iranian (11) populations where these two methods have been compared to assess IR and, it has been established that the TyG index is better than the HOMA index, in both cases. Due to the determination of TyG is less expensive in time and cost, this indicator could be used routinely in clinical settings; thus, it would be of great interest to identify their correspondence with HOMA index.
The aim of this study is to determine the concordance between the insulin resistance indicators, HOMA and TyG, due to the effect of a moderate-intensity aerobic exercise session in sedentary young women.
Materials and methods
Present analysis is based on an intervention study in sedentary young women, which was approved by the Research Ethics Committee at Central State of Chihuahua Hospital and the Faculty of Medicine at Autonomous University of Chihuahua with registration number A-120/14.
Participants
A sample of 22 sedentary young women was selected, recruited from a group of students interested to participate, who actively responded to the invitation. Each of them signed an informed consent of voluntary participation; their health status was evaluated through a medical examination. Women who reported having at least 12 months without regular physical exercise were considered for the study, after a guided questionnaire was filled out to ensure that participants were not physically active. Women with joint or muscular problems, pregnant or lactating, were excluded.
Anthropometric Measurement
Anthropometric measurements were performed using the International Society for the Advancement of Kinanthropometry (ISAK) technique (12). Restricted profile was measured, using a Rosscraft equipment. All variables were taken per duplicate by an ISAK Level 2 Anthropometrist. Body mass index (BMI) and waist-hip index (WHR) were calculated; the proportional sum of six skinfolds (SP6P) was determined.
Preliminary studies
Level of daily physical activity was estimated in metabolic equivalents (MET) through a questionnaire according to the Ainsworth Global Compendium of Physical Activities (13). Women were classified as sedentary if their daily activity was equivalent to an effort equal to or less than 3 METs, having stated that they did not perform additional exercise to daily activities. Baseline blood samples were obtained after 10-12 hours of fasting to obtain plasma concentrations of glucose and triglycerides by the GOD-PAP and GPO-POP method (Spinreact S.A., Ginora, Spain) respectively; and insulin by the ELISA method (Accubind, Monobind, CA, USA.).
HOMA index was calculated using the following formula: Fasting blood glucose (mmol) * Insulin (μIU/ml) /22.5 (7). Estimation of triglycerides and glucose index (TyG) was carried out by the following formula: Ln [Fasting triglycerides (mg/dl) x Fasting glucose (mg/dl)/2] (9).
Intervention
Participants performed 55 min of a moderate intensity aerobic exercise (MIAE), between 40% and 59% of heart rate reserve, in a single load, using a stationary Spinning type bicycle; each session included 5 min of warm-up, 45 min of core part, and 5 min of cool down. To determine glucose, insulin and triglycerides in plasma, a fasting blood sample was obtained from each participant, immediately before performing the programmed MIAE; other sample was taken at the end of the activity.
Statistical analysis
Normality of variables was verified by Shapiro-Wilk test. Student's t test was used to compare parametric variables. Comparison of non-parametric data was made with Wilcoxon test. Association between variables was verified with Spearman's Correlation and Kendall's Tau-b. IR indices were compared each other using Bland & Altman graphs, and Kappa Coefficient was used to estimate the proportion of concordance observed between the methods. Significant differences were considered at values of p≤0.01.
Results
A total of 22 sedentary young women between ages 18 and 35 participated in this study. Their morphological characteristics are shown in Table 1.
Table 1. Morphological characteristics of the participants.
| n=22 | Mean± DE | Minimum | Maximum |
|---|---|---|---|
| Age (years) | 21.9 ± 4.1 | 18.6 | 35.0 |
| Body mass (kg) | 67.1 (49.5-73.7) | 42.4 | 97.8 |
| BMI (kg/m2) | 24.8 ± 5,7 | 16.8 | 37.7 |
| SP6P | 128.4 ± 47.8 | 53.7 | 207.6 |
| WHR | 0.79 ± 0.08 | 0.69 | 0.95 |
BMI=Body mass index SP6P= proportional sum of six skinfolds. WHR= waist-hip index. Body mass (kg) is expressed as median and interquartile interval
Table 2 shows glucose, insulin, and triglyceride levels in plasma; as well as HOMA and TyG indices. No differences were found in any of the variables due to the programmed exercise.
Table 2. Biochemical characteristics of the participants.
| n=22 | Glucose (mmol/L) | Triglycerides (mg/dL) | Insulin (µIU/ml) | HOMA-RI | TyG index |
|---|---|---|---|---|---|
| Pre | 5.4 ± 0.40 | 99.9 ± 49.1 | 11.7 (6.9, 17.1) | 2.9 (1.7, 4.0) | 4.5 (4.3, 4.7) |
| Post | 5.4 ± 0.40 | 103.0 ± 54.8 | 11.6 (9.4, 17.5) | 2.8 (2.2, 4.4) | 4.5 (4.3, 4.7) |
| p | 0.461 | 0.607 | 0.666 | 0.866 | 0.749 |
Glucose and Triglycerides are expressed as mean and standard deviation. Insulin, HOMA-RI index and TyG index in median and interquartile range (25 and 75 percentile). Pre means before exercise. Post is after exercise. p indicates statistical significance.
Correlation of Spearman's Rho and Kendall's Tau-b before MIAE were significant and direct (r = 0.634, p <0.001 and r = 0.480, p <0.001; respectively).
Agreement was observed through a Bland & Altman graph, establishing the limits at ± 1.96 standard deviations of the mean of differences. A mean of differences of -0.48 ± 1.45 with a confidence interval between -0.126 and -0.840 was found between HOMA and TyG values before the administration of the exercise. Regression line indicated that differences between both measurements were not homogeneously distributed (β = -4.17; p = 0.001). Upper concordance limit was 0.96 and lower concordance limit was -1.93, with a standard error of estimation of 0.21. Graphically, it is observed that the point cloud is positively inclined, as the mean difference between HOMA and TyG will vary with the average value of HOMA and TyG (Figure 1).
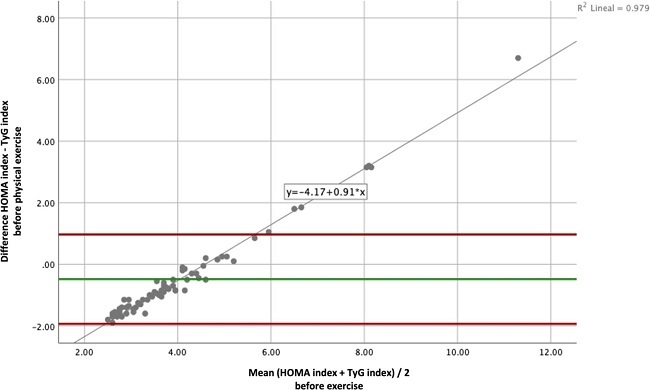
Figure 1. Bland & Altman plot shows the concordance between HOMA and TyG indices before exercise. Green line indicates the mean of differences between. HOMA and TyG indices; red lines are the limits of agreement at 1.96 standard deviations from the mean of differences and gray line represents the linear regression line.
Estimation of interobserver concordance between the diagnosis of IR or not-IR by HOMA and TyG before the programmed exercise, was observed through Cohen's Kappa index, whose result indicated a moderate strength of agreement (k = 0.585). For the presence of IR, a concordance of 40.9% was evidenced, and 37.9% for the cases without IR.
Spearman's Rho and Kendall's Tau-b correlations between both indicators, measured after MIAE, were significant (r = 0.650; p<0.001 and r = 0.504; p <0.001; respectively). Linear regression coefficients were calculated with TyG index as the dependent variable and HOMA index as the independent variable.
Concordance through Bland & Altman graph determined a mean of differences of -0.48 ± 1.45 with a confidence interval between -0.60 and -1.74 between values of HOMA and TyG indices after exercise. Regression line indicated that differences between both measurements were not homogeneously or consistently distributed (β = -7.81; p = 0.001). Graphically, it is observed that point cloud is positively inclined, as the mean difference between HOMA and TyG will vary with the average value of HOMA and TyG after the exercise (Figure 2).
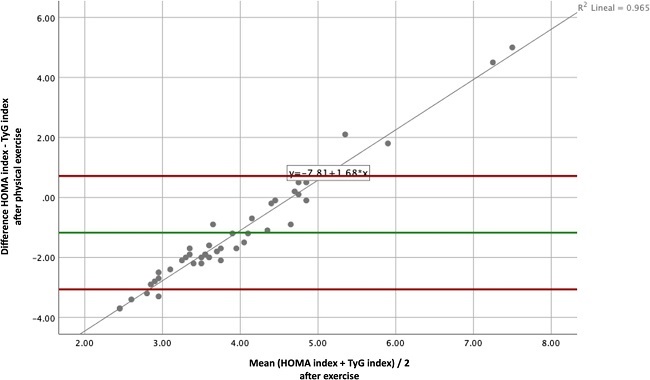
Figure 2. Bland & Altman plot expresses the concordance between HOMA and TyG indices, after exercise. Green line indicates the mean of differences between HOMA and TyG; red lines are the limits of agreement at 1.96 standard deviations from the mean of differences and gray line represents the linear regression line.
Estimation of interobserver concordance between the diagnosis of IR or not-IR by HOMA and TyG after the exercise, was observed through the Cohen's Kappa index (k=0.390). A concordance of 38.6% was shown for the presence of IR; and 29.5% for cases without IR.
Discussion
Results of this study show a better concordance for the estimation of RI between both indicators, HOMA and TyG, before MIAE, than after it. Studies with a better correlation of TyG index have been observed with some factors present in OW and O, such as BMI, fasting blood insulin levels and waist circumference, compared to HOMA index (10,14). Authors considered that TyG index represents a useful and accessible tool for the assessment of IR.
Hypothesis that an increase of triglyceride levels interferes with muscle glucose metabolism is also recognized, which may lead to a decrease in insulin sensitivity. It has also been considered that the content of hepatic triglycerides is a determinant of hepatic resistance to insulin, while the intramyocellular triglyceride is a determinant of muscular resistance to insulin, what supports the important role that triglycerides play in IR (5,9,15).
In the present study, correlations between indicators used to determine IR before and after MIAE, were high and significant; this suggests that there is a relationship between both indices. In Bland & Altman graphs, point cloud is positive and equally inclined at both before and after; and values outside the concordance lines are observed. Likewise, the value of differences between both means is below zero, that is, when subtracting those of TyG index from HOMA index values, a negative result will indicate that values of the first indicator are lower than those of the second.
On the other hand, Kappa index obtained a better concordance to detect the presence or absence of IR before MIAE, than after having carried out the exercise. It is probable that the increase in triglyceride concentration after MIAE is evidence of its breakdown into free fatty acids as an energy source during exercise (16). Therefore, TyG index does not seem to be a good tool to evaluate IR after an exercise, since it does not directly detect changes in insulin levels and is conditioned by triglycerides variations in plasma.
It has been suggested that TyG index may be useful to determine IR in large-scale studies or to examine populations at high risk of developing T2DM, and that it has been well recognized as an alternative test to identify IR where insulin measurement is not available (9); however, in light of the results of the present study, TyG index should be a subject of investigation since the decrease in IR by an exercise cannot be characterized by this indicator due to the variability of triglyceride concentrations during MIAE.
Conclusions
TyG index is a good indicator for assessment IR at baseline conditions; nevertheless, it is not suitable for assessing IR after the administration of MIAE, due to the increase in triglycerides for use during exercise.
Transparency
The corresponding author, on behalf of the rest of the signatories, guarantees the precision, transparency and veracity of the data and information contained in the study; no relevant information has been omitted; and all discrepancies between authors have been resolved and adequately described.

