<?xml version="1.0" encoding="ISO-8859-1"?><article xmlns:mml="http://www.w3.org/1998/Math/MathML" xmlns:xlink="http://www.w3.org/1999/xlink" xmlns:xsi="http://www.w3.org/2001/XMLSchema-instance">
<front>
<journal-meta>
<journal-id>0212-1611</journal-id>
<journal-title><![CDATA[Nutrición Hospitalaria]]></journal-title>
<abbrev-journal-title><![CDATA[Nutr. Hosp.]]></abbrev-journal-title>
<issn>0212-1611</issn>
<publisher>
<publisher-name><![CDATA[Grupo Arán]]></publisher-name>
</publisher>
</journal-meta>
<article-meta>
<article-id>S0212-16112012000200033</article-id>
<title-group>
<article-title xml:lang="en"><![CDATA[Confirming the validity of the CONUT system for early detection and monitoring of clinical undernutrition: comparison with two logistic regression models developed using SGA as the gold standard]]></article-title>
<article-title xml:lang="es"><![CDATA[Confirmando la validez del sistema CONUT para la detección precoz de la desnutrición clínica: Comparación con dos modelos de regresión logística desarrollados usando el SGA como gold standard]]></article-title>
</title-group>
<contrib-group>
<contrib contrib-type="author">
<name>
<surname><![CDATA[González-Madroño]]></surname>
<given-names><![CDATA[A.]]></given-names>
</name>
<xref ref-type="aff" rid="A01"/>
</contrib>
<contrib contrib-type="author">
<name>
<surname><![CDATA[Mancha]]></surname>
<given-names><![CDATA[A.]]></given-names>
</name>
<xref ref-type="aff" rid="A01"/>
</contrib>
<contrib contrib-type="author">
<name>
<surname><![CDATA[Rodríguez]]></surname>
<given-names><![CDATA[F. J.]]></given-names>
</name>
<xref ref-type="aff" rid="A02"/>
</contrib>
<contrib contrib-type="author">
<name>
<surname><![CDATA[Culebras]]></surname>
<given-names><![CDATA[J.]]></given-names>
</name>
<xref ref-type="aff" rid="A03"/>
<xref ref-type="aff" rid="A04"/>
</contrib>
<contrib contrib-type="author">
<name>
<surname><![CDATA[de Ulibarri]]></surname>
<given-names><![CDATA[J. I.]]></given-names>
</name>
<xref ref-type="aff" rid="A01"/>
</contrib>
</contrib-group>
<aff id="A01">
<institution><![CDATA[,Hospital Universitario de La Princesa Sección de Nutrición Clínica y Dietética ]]></institution>
<addr-line><![CDATA[Madrid ]]></addr-line>
<country>España</country>
</aff>
<aff id="A02">
<institution><![CDATA[,Hospital Universitario de La Princesa Instituto de Investigación ]]></institution>
<addr-line><![CDATA[Madrid ]]></addr-line>
<country>España</country>
</aff>
<aff id="A03">
<institution><![CDATA[,Complejo Asistencial de la Universidad de León Servicio de Cirugía ]]></institution>
<addr-line><![CDATA[León ]]></addr-line>
</aff>
<aff id="A04">
<institution><![CDATA[,Universidad de León Instituto de Biomedicina (IBIOMED) ]]></institution>
<addr-line><![CDATA[León ]]></addr-line>
<country>España</country>
</aff>
<pub-date pub-type="pub">
<day>00</day>
<month>04</month>
<year>2012</year>
</pub-date>
<pub-date pub-type="epub">
<day>00</day>
<month>04</month>
<year>2012</year>
</pub-date>
<volume>27</volume>
<numero>2</numero>
<fpage>564</fpage>
<lpage>571</lpage>
<copyright-statement/>
<copyright-year/>
<self-uri xlink:href="http://scielo.isciii.es/scielo.php?script=sci_arttext&amp;pid=S0212-16112012000200033&amp;lng=en&amp;nrm=iso"></self-uri><self-uri xlink:href="http://scielo.isciii.es/scielo.php?script=sci_abstract&amp;pid=S0212-16112012000200033&amp;lng=en&amp;nrm=iso"></self-uri><self-uri xlink:href="http://scielo.isciii.es/scielo.php?script=sci_pdf&amp;pid=S0212-16112012000200033&amp;lng=en&amp;nrm=iso"></self-uri><abstract abstract-type="short" xml:lang="en"><p><![CDATA[Aim: To ratify previous validations of the CONUT nutritional screening tool by the development of two probabilistic models using the parameters included in the CONUT, to see if the CONUT´s effectiveness could be improved. Methods: It is a two step prospective study. In Step 1, 101 patients were randomly selected, and SGA and CONUT was made. With data obtained an unconditional logistic regression model was developed, and two variants of CONUT were constructed: Model 1 was made by a method of logistic regression. Model 2 was made by dividing the probabilities of undernutrition obtained in model 1 in seven regular intervals. In step 2, 60 patients were selected and underwent the SGA, the original CONUT and the new models developed. The diagnostic efficacy of the original CONUT and the new models was tested by means of ROC curves. Both samples 1 and 2 were put together to measure the agreement degree between the original CONUT and SGA, and diagnostic efficacy parameters were calculated. Results: No statistically significant differences were found between sample 1 and 2, regarding age, sex and medical/surgical distribution and undernutrition rates were similar (over 40%). The AUC for the ROC curves were 0.862 for the original CONUT, and 0.839 and 0.874, for model 1 and 2 respectively. The kappa index for the CONUT and SGA was 0.680. Conclusions: The CONUT, with the original scores assigned by the authors is equally good than mathematical models and thus is a valuable tool, highly useful and efficient for the purpose of Clinical Undernutrition screening.]]></p></abstract>
<abstract abstract-type="short" xml:lang="es"><p><![CDATA[Objetivo: Ratificar validaciones previas del sistema de cribado nutricional CONUT, mediante el desarrollo de dos modelos probabilísticos usando los parámetros incluidos en el CONUT, para ver si la efectividad del CONUT puede ser mejorada. Métodos: Estudio prospectivo en dos fases. En la fase I se seleccionaron 101 pacientes al azar, y se les hicieron SGA y CONUT. Con estos datos se fabricó un modelo de regresión logística incondicional, y se construyeron dos variantes del CONUT. El modelo 1 se hizo mediante regresión logística. El modelo 2 se hizo dividiendo las probabilidades de desnutrición obtenidas en el modelo 1 en siete intervalos regulares. En la fase 2, se seleccionaron 60 pacientes, y se les hizo el SGA, CONUT y los nuevos modelos desarrollados. La eficacia diagnóstica del CONUT original y de los nuevos modelos se estudió mediante curvas ROC. Se juntaron las muestras 1 y 2 para medir el grado de acuerdo entre el CONUT original y el SGA, y se calcularon los índices de eficacia. Resultados: No se encontraron diferencias significativas entre las muestras 1 y 2, en cuanto a la distribución de sexos y servicios, las tasas de desnutrición fueron similares (alrededor del 40%). El AUC para las curvas ROC fueron 0,862 para el CONUT original, y 0,839 y 0,874 para modelos 1 y 2 respectivamente. El índice kappa entre el CONUT y el SGA fue 0,680. Conclusión: El CONUT, con las puntuaciones asignadas originalmente por los autores, es tan bueno como los modelos matemáticos y por tanto, válido, muy útil y eficiente para el cribado de la desnutrición Clínica.]]></p></abstract>
<kwd-group>
<kwd lng="en"><![CDATA[Nutritional screening]]></kwd>
<kwd lng="en"><![CDATA[CONUT]]></kwd>
<kwd lng="en"><![CDATA[Clinical undernutrition]]></kwd>
<kwd lng="en"><![CDATA[Serum albumin]]></kwd>
<kwd lng="en"><![CDATA[Total cholesterol]]></kwd>
<kwd lng="es"><![CDATA[Screening nutricional]]></kwd>
<kwd lng="es"><![CDATA[CONUT]]></kwd>
<kwd lng="es"><![CDATA[Desnutrición clínica]]></kwd>
<kwd lng="es"><![CDATA[Albúmina sérica]]></kwd>
<kwd lng="es"><![CDATA[Colesterol total]]></kwd>
</kwd-group>
</article-meta>
</front><body><![CDATA[ <p><a name="top"></a><font face="Verdana" size="2"><b>ORIGINAL</b></font></p>     <p>&nbsp;</p>     <p><font face="Verdana" size="4"><b>Confirming the validity of the CONUT system for early detection and monitoring of clinical undernutrition; comparison with two logistic regression models developed using SGA as the gold standard</b></font></p>     <p><font face="Verdana" size="4"><b>Confirmando la validez del sistema CONUT para la detección precoz de la desnutrición clínica. Comparación con dos modelos de regresión logística desarrollados usando el SGA como gold standard</b></font></p>     <p>&nbsp;</p>     <p>&nbsp;</p>     <p><font face="Verdana" size="2"><b>A. González-Madroño<sup>1</sup>, A. Mancha<sup>1</sup>, F. J. Rodríguez<sup>2</sup>, J. Culebras<sup>3</sup> and J. I. de Ulibarri<sup>1</sup></b></font></p>     <p><font face="Verdana" size="2"><sup>1</sup>Sección de Nutrición Clínica y Dietética. Hospital Universitario de La Princesa. Madrid. España.    <br><sup>2</sup>Instituto de Investigación del Hospital Universitario de La Princesa. Madrid. España.    <br><sup>3</sup>Servicio de Cirugía. Complejo Asistencial de la Universidad de León. Instituto de Biomedicina (IBIOMED). Universidad de León. León. España.</font></p>     ]]></body>
<body><![CDATA[<p><font face="Verdana" size="2">Our sincere gratitude to VEGENAT S.A for their continuous support to this project since its inception.</font></p>     <p><font face="Verdana" size="2"><a href="#bajo">Correspondence</a></font></p>     <p>&nbsp;</p>     <p>&nbsp;</p> <hr size="1">     <p><font face="Verdana" size="2"><b>ABSTRACT</b></font></p>     <p><font face="Verdana" size="2"><b>Aim:</b> To ratify previous validations of the CONUT nutritional screening tool by the development of two probabilistic models using the parameters included in the CONUT, to see if the CONUT´s effectiveness could be improved.    <br><b>Methods:</b> It is a two step prospective study. In Step 1, 101 patients were randomly selected, and SGA and CONUT was made. With data obtained an unconditional logistic regression model was developed, and two variants of CONUT were constructed: Model 1 was made by a method of logistic regression. Model 2 was made by dividing the probabilities of undernutrition obtained in model 1 in seven regular intervals. In step 2, 60 patients were selected and underwent the SGA, the original CONUT and the new models developed. The diagnostic efficacy of the original CONUT and the new models was tested by means of ROC curves. Both samples 1 and 2 were put together to measure the agreement degree between the original CONUT and SGA, and diagnostic efficacy parameters were calculated.    <br><b>Results:</b> No statistically significant differences were found between sample 1 and 2, regarding age, sex and medical/surgical distribution and undernutrition rates were similar (over 40%). The AUC for the ROC curves were 0.862 for the original CONUT, and 0.839 and 0.874, for model 1 and 2 respectively. The kappa index for the CONUT and SGA was 0.680.    <br><b>Conclusions:</b> The CONUT, with the original scores assigned by the authors is equally good than mathematical models and thus is a valuable tool, highly useful and efficient for the purpose of Clinical Undernutrition screening.</font></p>     <p><font face="Verdana" size="2"><b>Key words:</b> Nutritional screening. CONUT. Clinical undernutrition. Serum albumin. Total cholesterol.</font></p> <hr size="1">     ]]></body>
<body><![CDATA[<p><font face="Verdana" size="2"><b>RESUMEN</b></font></p>     <p><font face="Verdana" size="2"><b>Objetivo:</b> Ratificar validaciones previas del sistema de cribado nutricional CONUT, mediante el desarrollo de dos modelos probabilísticos usando los parámetros incluidos en el CONUT, para ver si la efectividad del CONUT puede ser mejorada.    <br><b>Métodos:</b> Estudio prospectivo en dos fases. En la fase I se seleccionaron 101 pacientes al azar, y se les hicieron SGA y CONUT. Con estos datos se fabricó un modelo de regresión logística incondicional, y se construyeron dos variantes del CONUT. El modelo 1 se hizo mediante regresión logística. El modelo 2 se hizo dividiendo las probabilidades de desnutrición obtenidas en el modelo 1 en siete intervalos regulares. En la fase 2, se seleccionaron 60 pacientes, y se les hizo el SGA, CONUT y los nuevos modelos desarrollados. La eficacia diagnóstica del CONUT original y de los nuevos modelos se estudió mediante curvas ROC. Se juntaron las muestras 1 y 2 para medir el grado de acuerdo entre el CONUT original y el SGA, y se calcularon los índices de eficacia.    <br><b>Resultados:</b> No se encontraron diferencias significativas entre las muestras 1 y 2, en cuanto a la distribución de sexos y servicios, las tasas de desnutrición fueron similares (alrededor del 40%). El AUC para las curvas ROC fueron 0,862 para el CONUT original, y 0,839 y 0,874 para modelos 1 y 2 respectivamente. El índice kappa entre el CONUT y el SGA fue 0,680.    <br><b>Conclusión:</b> El CONUT, con las puntuaciones asignadas originalmente por los autores, es tan bueno como los modelos matemáticos y por tanto, válido, muy útil y eficiente para el cribado de la desnutrición Clínica.</font></p>     <p><font face="Verdana" size="2"><b>Palabras clave:</b> Screening nutricional. CONUT. Desnutrición clínica. Albúmina sérica. Colesterol total.</font></p> <hr size="1">     <p><font face="Verdana" size="2"><b>Abreviations</b>    <br>NRS2002: Nutritional Risk Screening 2002.    <br>MNA: Mini Nutritional Assessment.    <br>MUST: Malnutrition Universal Screening Tool.    ]]></body>
<body><![CDATA[<br>SGA: Subjetive Global Assessment.    <br>CONUT: Nutritional Control (from the Spanish expression CONtrol NUTricional).    <br>FNA: Full Nutritional Assessment.    <br>SENPE: Sociedad Española de Nutrición Parenteral y Enteral.    <br>TLC: Total Lymphocyte Count.    <br>SD: Standard Deviation.    <br>ANOVA: Analysis of Variance.    <br>ROC: Receiver Operating Characteristic.    <br>AUC: Area Under the Curve.    <br>CI: Confidence Interval.</font></p>     ]]></body>
<body><![CDATA[<p>&nbsp;</p>     <p><font face="Verdana" size="2"><b>Introduction</b></font></p>     <p><font face="Verdana" size="2">Undernutrition is a common problem in hospitalized patients, with serious consequences on clinical course, increased complications and longer hospital stays.<sup>1,2</sup> Bristian et al.<sup>3,4</sup> published the first studies about Hospital Malnutrition many years ago, but prevalence rates have remained almost constant over the years, varying between 30-60% depending on the series.<sup>5,6</sup> These high rates may be attributed to the more aggressive clinical procedures that are being applied at present, despite the proliferation of new techniques and products to improve nutritional support.</font></p>     <p><font face="Verdana" size="2">In order to prevent and treat undernutrition from its early stages, we advocate, once again, for the study of Clinical Undernutrition, a concept already introduced in the "Undernutrition White Book",<sup>7</sup> defined as the deficiency situation developed as a result of disease and therapeutical procedures applied, which starts at the beginning of the disease or the treatment, and continues frequently after hospital discharge.</font></p>     <p><font face="Verdana" size="2">In recent years several large studies have been developed to assess the impact of nutritional support on different clinical outcomes on undernourished patients. Many benefits have been proven in reducing complication, mainly due to lower infection rates,<sup>8</sup> reduced resources consumption and reduced overall costs.<sup>9</sup></font></p>     <p><font face="Verdana" size="2">In order to treat undernourished patients, we must firstly identify them, and quantify and define their undernutrition. Most of the nutritional screening methods currently used for this purpose, as the NRS2002,<sup>10</sup> MNA,<sup>11</sup> MUST,<sup>12</sup> and other more complete methods for nutritional assessment as SGA,<sup>13</sup> are based on clinical parameters (anamnesis and anthropometrical), that should be handmade for sanitary staff, depending on resources availability and increasing costs. The fact is that today, there are very few hospitals where all inpatients are routinely and periodically screened, despite the recommendations that Council of Europe made on 2003.<sup>14</sup></font></p>     <p><font face="Verdana" size="2">In order to overcome these difficulties and to be able to screen as many patients as possible, our team has developed an automatic tool for nutritional screening, based only on data recorded on databases. It is called CONUT.<sup>15</sup> The first step is fully automatic, and uses analytical parameters: serum albumin, total cholesterol and total lymphocyte count, these data are already available on Clinical Laboratory databases. The requested analytical results are automatically collected by a specific software module that process the information and assigns a score generating a Nutritinal Alert, as a first step of Nutritional Control. This information is delivered to the patient´s physician in the analysis report.</font></p>     <p><font face="Verdana" size="2">The second phase of Nutritional Control is the assessment of Nutritional Risk, with a complete evaluation of the patient´s clinical condition, including anamnesis, physical and analytical examination, in order to decide the adequate nutritional support, if necessary.</font></p>     <p><font face="Verdana" size="2">Other research teams are approaching the development of automatically nutritional screening tools. Brugler et al.<sup>16</sup> developed in 2004 a simplified nutritional screen tool with 4 parameters already available in medical records (serum albumin, hemoglobin, total lymphocyte count and malnutrition-related admission diagnosis), that had been assigned scores according to mathematical models.</font></p>     <p><font face="Verdana" size="2">We have already evaluated the relation between the analytical parameters included in the CONUT system with different clinical indicators and nutritional assessments in previous works, and found that there is a direct and statistically significant relation between them and patient´s nutritional status, and therefore, they are useful for nutritional screening.<sup>17</sup> We have also compared the results obtained by the CONUT with a complete nutritional assessment (FNA, based on the SENPE recommendations) and obtained a kappa index = 0.669 as a measure of the agreement degree, a sensitivity of 92.30 and specificity of 85.00.<sup>15</sup> These results indicate that our tool is valid for nutritional screening for the early detection of clinical undernutrition, and after its implementation, we will achieve a significant improvement in quality of care, with costs reductions.</font></p>     ]]></body>
<body><![CDATA[<p><font face="Verdana" size="2">The aim of the present study was to ratify previous validations of the CONUT by the development of two probabilistic models, using the parameters included in CONUT, with the objective to assign to each variable specific scores based on regression model´s coefficients, and to validate and compare them with the results obtained by the original CONUT, to see if the tool´s effectiveness could be improved.</font></p>     <p>&nbsp;</p>     <p><font face="Verdana" size="2"><b>Material and methodology</b></font></p>     <p><font face="Verdana" size="2">A prospective study was carried out at the Hospital Universitario de la Princesa. Around 17,000 adult patients are admitted at this hospital every year. The study developed in two steps.</font></p>     <p><font face="Verdana" size="2"><i>Inclusion/exclusion criteria</i> (the same were used in both steps of the study): Inpatients from the medical and surgical services were included the study. Psychiatric, Hemodialisis and Intensive Care Unit patients were excluded. Patients without any routinary analytical check-ups during the first week on admission were also left out, as well as those admitted for either a diagnostic test, a short period of stay or those that had not signed the informed consent to enter the study.</font></p>     <p><font face="Verdana" size="2">Step I: A total of 101 patients were selected at random. They were taken under the following two nutritional assessments:</font></p>     <p><font face="Verdana" size="2"><i>Subjective Global Assessmen</i>t (SGA) is made by a nutritionist of the Dietetic Unit. The SGA assesses nutritional status based on clinical history and physical examination. The history records data related to weight changes in the last six months, modification on diet intakes, presence of gastrointestinal symptoms and functional capacity. The physical examination includes: presence of loss of subcutaneous fat, muscle wasting, ankle oedema and ascities. The exam classifies patients as well nourished, moderately or suspected of being undernourished and severely malnourished.<sup>13</sup></font></p>     <p><font face="Verdana" size="2"><i>CONUT</i>, is a nutritional screening tool developed in our department. It automatically evaluates the nutritional alert using two biochemical parameters (serum albumin and cholesterol level) and one immune indicator (total lymphocyte count). Serum albumin (g/dL) is used as an indicator of protein reserves and/or availability<sup>18,19,20</sup> total cholesterol (mg/dL) is used as a caloric depletion parameter,<sup>21,22</sup> and finally, total lymphocyte count (Cell/mL) is used as an indicator of loss of immune defences, presumably caused by undernutrition. <sup>23,24,25</sup> Serum albumin and total cholesterol were analyzed by a "Roche Modular Analyzer", and total lymphocyte count was analyzed by a "Roche Sysmex SE-9000 Hematology Analyzer".</font></p>     <p><font face="Verdana" size="2">The levels for these three parameters, as well as the scores assigned by the screening tool, according to the nutritional alert of undernutririon, are shown in <a target="_blank" href="/img/revistas/nh/v27n2/33_original_23_t1.gif">table I</a>. Following this rating (between 0 and 12 points), the application classifies patients in three groups according to their nutritional alert status: low alert, moderate alert and high alert. Scores have been placed by the authors, initially, according to the information published and the heuristic knowledge obtained from long experience. The albumin has double the rating than cholesterol and lymphocytes, as it provides more "weight" as an undernutrition indicator.</font></p>     <p><font face="Verdana" size="2">Since CONUT was developed by weighting each of the variables with the criterion based on previous clinical experience, and in order to adjust these scores, in this study we have developed an unconditional logistic regression model, upon which we have constructed two variants of CONUT, where the weights were made in a probabilistic way, one continuous and another discrete, as described below:</font></p>     ]]></body>
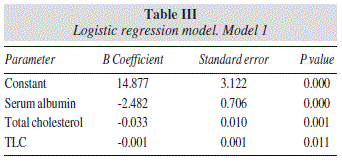
<body><![CDATA[<p><font face="Verdana" size="2"><i>Model 1</i>: was developed by a method of logistic regression, using presence/absence of malnutrition (evaluated by SGA collapsed in two categories: well nourished and malnourished) as a dependent variable, while serum albumin, total cholesterol and total lymphocyte count (TLC) were used as independent continuous variables (<a href="#t3">table III</a>).</font></p>     <p>&nbsp;</p>     <p align="center"><font face="Verdana" size="2"><a name="t3"><img src="/img/revistas/nh/v27n2/33_original_23_t3.gif" align="top"></a></font></p>     <p>&nbsp;</p>     <p><font face="Verdana" size="2"><i>Model 2:</i> a second model was developed to improve Model 1. It is based on the probabilities of undernutrition obtained by Model 1. We divided these probabilities in seven regular intervals, and those cutoff points defined in Model 2.</font></p>     <p><font face="Verdana" size="2">Step II: In order to evaluate the diagnostic efficacy of the two models developed in step I and to compare it to the original CONUT, another 60 patients were selected at random (Following the same criteria for selection as in Step I). SGA was carried out to all of them and the three clinical parameters were analyzed. They also underwent the original CONUT, and Model 1 and 2.</font></p>     <p><font face="Verdana" size="2"><i>Statistical analysis</i></font></p>     <p><font face="Verdana" size="2">Categorical variables were described as the number of cases and percentages, and continuous variables as the mean ± standard deviation (SD). Both samples are compared using the T-student test in order to check if they are equivalent.</font></p>     <p><font face="Verdana" size="2">An ANOVA test was carried out to test the significance of the difference in the mean levels of albumin, cholesterol and lymphocytes for the three nutritional status evaluated by SGA for the two samples.</font></p>     <p><font face="Verdana" size="2">Both models developed in Step I were applied to the validation sample (Sample 2). Its diagnostic efficacy was tested by means of ROC curves and the area under the curve (AUC) as well as the corresponding confidence interval (CI).</font></p>     ]]></body>
<body><![CDATA[<p><font face="Verdana" size="2">Both samples 1 and 2 were put together to measure the agreement degree between the original CONUT and the SGA results, and then the diagnostic efficacy parameters were calculated: sensibility, specificity, positive predictive value and negative predictive value.</font></p>     <p>&nbsp;</p>     <p><font face="Verdana" size="2"><b>Results</b></font></p>     <p><font face="Verdana" size="2">Sample description is shown in <a target="_blank" href="/img/revistas/nh/v27n2/33_original_23_t2.gif">table II</a>. Patients are slightly older in sample 1 (68,4 ± 16.8 vs. 63.20 ± 20.16). Sex distribution is different in both samples, showing sample 2 a higher percentage of males than in sample 1 (51.7% vs. 41.6%). Distribution of patients according to medical/surgical services is similar in both (79.21/20.80 vs. 83.3/16.7). Undernutrition rates are also very similar in both samples, with a prevalence of moderate and severe slightly higher than 40%. No statistically significant differences were found between samples 1 and 2.</font></p>     <p><font face="Verdana" size="2">The levels of the three parameters according to the undernutrition degree as evaluated by SGA are shown also in <a target="_blank" href="/img/revistas/nh/v27n2/33_original_23_t2.gif">table II</a>. It is important to point out that the levels of the three parameters decrease as the degree of undernutrition increases. Albumin levels lower as the undernutrition degree evaluated by SGA increases, in a similar way in both samples, and these differences in the means are significant (P = 0.000). In relation to cholesterol levels, only in sample 1 were any significant differences detected and the origin of this significance was found among normal and undernourished patients. It should be noted that cholesterol levels among both undernourished groups (moderate and severe) was very similar (134.8 vs 131.1). In sample 2 there is also an evident lowering trend of cholesterol as the degree of undernourishment increases, although this decrease does not get significant levels. Total lymphocyte count also tends to lower along with higher degree of undernutrition, being this trend of significance in both samples.</font></p>     <p><font face="Verdana" size="2">&beta; coefficients obtained in the logistic regression model (Model 1) are shown in <a href="#t3">table III</a> and the seven cut points obtained in Model 2 are as follows: &gt; 0.88, 0.88-0.84, 0.83-0.68, 0.67-0.34, 0.33-0.13, 0.12-0.06, &lt; 0.05.</font></p>     <p><font face="Verdana" size="2">The ROC curves for the three models and their corresponding AUC and CI are shown in <a target="_blank" href="/img/revistas/nh/v27n2/33_original_23_f1.gif">figure 1</a>, and it can be made evident that in all three cases the area under the curve is higher than 0.8.</font></p>     <p><font face="Verdana" size="2">The results of agreement degree as well as the efficacy parameters are shown in <a target="_blank" href="/img/revistas/nh/v27n2/33_original_23_t4.gif">table IV</a>.</font></p>     <p>&nbsp;</p>     <p><font face="Verdana" size="2"><b>Discussion</b></font></p>     ]]></body>
<body><![CDATA[<p><font face="Verdana" size="2">We have been working with the automatic system for nutritional screening called CONUT for more than twenty years. Throughout the years this tool, as well as the interpretation of its scores, have been improved many times, being the present study an example of this.</font></p>     <p><font face="Verdana" size="2">When CONUT was first conceived, it consisted of four categories of nutritional alert (normal, light, moderate and severe). During the first trials of the tool, we compared the results with those obtained by means of the FNA protocol that was used in our hospital and those obtained by SGA, both of which were very similar.<sup>15</sup> As a consequence of this and considering the SGA a very well known and accurate tool, we decided to take it as gold standard. Also, in order to ease the comparison between the two tools, SGA and CONUT, we decided to merge the first two categories (normal and light, comprising scores between 0-4 range) and to group them within the "low alert of undernutrition" range. This was due to the fact that we had observed that the original CONUT tended to overestimate undernutrition rather too much.</font></p>     <p><font face="Verdana" size="2">This new classification of the scores obtained by CONUT was much more in agreement with SGA.<sup>15</sup> The three ranges of Nutritional Alert were hence reduced as follows: Low (less than 4, including normal ones and those previously considered light), Moderate (those comprised between 5 and 8), and High (those higher than 8), as shown in <a target="_blank" href="/img/revistas/nh/v27n2/33_original_23_t1.gif">table I</a>.</font></p>     <p><font face="Verdana" size="2">Several have been the critics that we received after presenting in different communication sets our studies on malnutrition prevalence and the relationship between undernutrition and different indicators of clinical outcomes, using CONUT for the assessment of undernutrition degree. Most of the critics were pointed at the fact that the scores used by the tool were arbitrary and that they should be based on logistic regression models in order to be considered adequate. All these critics were made regardless of the fact that the results obtained until then relating the agreement degree with the results of other previously validated methods, such as SGA, and also the estimate of efficiency parameters, both indicated that the scores were valid. This is the reason why we decided to carry out this study and to apply both probabilistic models with the parameters used by CONUT.</font></p>     <p><font face="Verdana" size="2">When comparing the two samples applied in this study, no significant differences were found and consequently it can be stated that both are useful in order to prove the diagnostic efficacy of the models developed on sample 1.</font></p>     <p><font face="Verdana" size="2">Prevalence of undernutrition (40%) in both samples proved to be similar to that detected in previous studies at our hospital and slightly higher than that obtained lately during a multicentric study carried out in Spain (PREDYCES study), in which a prevalence of 23%<sup>26</sup> was found. This difference is probably due to the method used for nutritional assessment and the inclusion criteria applied in each study, being our aim (with the first step of CONUT system) the detection of undernutrition at the early stages, while in the case of the NRS2002 the aim is to detect nutritional risk.</font></p>     <p><font face="Verdana" size="2">The analysis of the changes shown by the parameters applied by the tool, at the different degrees of undernutrition as evaluated by SGA, confirms once more their close relationship with undernutrition. Therefore we can say that they are useful for nutritional screening. In a previous study we have already discussed its efficacy for that purpose; the pros and cons were also explained as well as the characteristics of each parameter.<sup>17</sup> We sustained the concept that, despite any objections that could possibly be made to each of the parameters regarding clinical undernutrition, their efficacy for the purpose of nutritional screening is evident (baring in mind at all times that we make reference to screening and not to a definite nutritional assessment).</font></p>     <p><font face="Verdana" size="2">The purpose of the present study was to confirm the usefulness of this tool, by comparing the results with a wider sample, and to improve its diagnostic ability by replacing, wherever necessary, the scores that had been assigned to each of the CONUT parameters, with other ones based on mathematical models. However, the analysis of the ROC curves that were obtained by comparing the results of the three models (that is, original CONUT, model 1 and model 2) with the scores obtained with SGA, indicate that these new models, despite their complexity, have not improved the tools potential to detect undernourished patients. This conclusion can be drawn when considering that the AUC of the original CONUT is 0.862, while Models 1 and 2 are 0.839 and 0.874 respectively (<a target="_blank" href="/img/revistas/nh/v27n2/33_original_23_f1.gif">figure 1</a>).</font></p>     <p><font face="Verdana" size="2">The kappa index that was obtained by comparing the results of the original CONUT with those of SGA as "gold standard" is 0.680, which, according to Altman<sup>27</sup> is considered a good score. The results of an estimation of the efficacy rates indicate that the test can be considered more specific (89.13) rather than sensitive (78.26). Although this means that a portion of seriously undernourished patients may pass undetected, these scores are still quite good ones for a screening system.<sup>28</sup> Both positive and negative predictive scores are very similar (84.38 vs. 84.54).</font></p>     <p><font face="Verdana" size="2">As a consequence it can be said that CONUT, with the scores assigned initially to each parameter by the authors, consists of a much simpler tool than models 1 and 2 because it is based on a table that can be easily interpreted and applied. CONUT is, as such, an equally effective tool for the detection of patients on nutritional alert.</font></p>     ]]></body>
<body><![CDATA[<p><font face="Verdana" size="2">With this very simple method for nutritional screening it is possible to alert, at early stages, of the possibility that a patient has already begun an undernutrition process. This automatic screening tool is designed to become active each time that doctors ask for a routine analytical control to admitted patients. All this should be considered as a complement to the medical nutritional assessment, considering other aspects related to nutritional status and the presence of trofopatic situations such as either consumptive and/or severe disease, or aggressive type of treatment.</font></p>     <p><font face="Verdana" size="2">All CONUT results below 5 do not require any particular attention in the clinical practice. Each time that the patient´s physician asks for further analytical check-up tests, the system will repeat the screening, and nutritional control will continue while the patient is being treated clinically treated, resulting in the new analytical report an updated assessment of nutritional alert. This way, the new analytical form will issue an updated assessment of the degree of nutritional alert.</font></p>     <p><font face="Verdana" size="2">If the result is above 4, a full nutritional assessment will take place and eventual nutritional support applied. This will be carried out either by the doctor in charge of the patient or by a specialized nutritional unit, according to the protocol and particular management of the hospital in question.</font></p>     <p><font face="Verdana" size="2">The latest inclusion of CONUT Nutritional Alert to the main technological systems of Clinical Analysis Labs has paved the way for its adaptation to Spanish hospitals, Residences and First Aid Services. It has become a prophylactic and therapeutic method to automatically control the assessment of Nutritional Alert, being activated with each analytical check-up (<a target="_blank" href="/img/revistas/nh/v27n2/33_original_23_f2.gif">fig. 2</a>).</font></p>     <p><font face="Verdana" size="2">Nowadays it appears that more teams tend to prefer automatic systems to deal with nutritional screening. An example of this is the study published by Brugler and cols in 2005,<sup>16</sup> they published an article that introduced a simplified nutritional screening method for hospitalized patients using readily available laboratory and patient information. They sustained that serum albumin and total lymphocyte count are among the most relevant parameters to be considered when analyzing malnutrition related complications (they do not consider total cholesterol on their study), and these can be useful to apply, together with other parameters, in automatic undernutrition screening.</font></p>     <p><font face="Verdana" size="2">We are of the opinion that it is both scientist and clinician´s need and duty to develop and improve their diagnostic models. Furthermore, we also sustain that technology would rather be developed from clinical practice because by doing so it would be possible to achieve a better understanding, not only of the "field" in question, but also of its particular problems and needs, as well as the possible solutions to them.</font></p>     <p>&nbsp;</p>     <p><font face="Verdana" size="2"><b>Conclussions</b></font></p>     <p><font face="Verdana" size="2">The CONUT, with the scores that were originally conceived by its authors according to "heuristic knowledge" and clinical experience, can be said to be able to issue equally results than a model which was designed on the basis of logistic regression or constructed out of the estimated probability of the logistic model, since we have not found any statistically significant differences between them. Therefore, we can validate the scores assigned on the original CONUT model, adjusted to the SGA results.</font></p>     <p><font face="Verdana" size="2">Finally, the present study confirms, once again, that CONUT is a valuable tool to be considered highly useful and efficient for the purpose of Clinical Undernutrition screening.</font></p>     ]]></body>
<body><![CDATA[<p>&nbsp;</p>     <p><font face="Verdana" size="2"><b>References</b></font></p>     <!-- ref --><p><font face="Verdana" size="2">1. Raslan M, Gonzalez MC, Torrinhas RS, Ravacci GR, Pereira JC, Waitzberg DL. Complementarity of Subjective Global Assessment (SGA) and Nutritional Risk Screening 2002 (NRS 2002) for predicting por clinical outcomes in hospitalized patients. <i>Clin Nutr</i> 2011; 30 (1): 49-53.    &nbsp;&nbsp;&nbsp;&nbsp;&nbsp;&nbsp;&nbsp;&nbsp;[&#160;<a href="javascript:void(0);" onclick="javascript: window.open('/scielo.php?script=sci_nlinks&ref=3667469&pid=S0212-1611201200020003300001&lng=','','width=640,height=500,resizable=yes,scrollbars=1,menubar=yes,');">Links</a>&#160;]<!-- end-ref --></font></p>    <!-- ref --><p><font face="Verdana" size="2">2. Beghetto MG, Luft VC, Mello ED, Polanczyk CA. Accuracy of nutritional assessment tools for predicting adverse hospital outcomes. <i>Nutr Hosp</i> 2009; 24 (1): 56-62.    &nbsp;&nbsp;&nbsp;&nbsp;&nbsp;&nbsp;&nbsp;&nbsp;[&#160;<a href="javascript:void(0);" onclick="javascript: window.open('/scielo.php?script=sci_nlinks&ref=3667471&pid=S0212-1611201200020003300002&lng=','','width=640,height=500,resizable=yes,scrollbars=1,menubar=yes,');">Links</a>&#160;]<!-- end-ref --></font></p>    <!-- ref --><p><font face="Verdana" size="2">3. Bistrian BR, Blackburn GL, Hallowell E, Heddle R. Protein status on general surgical patients. <i>JAMA</i> 1974; 230: 858-860.    &nbsp;&nbsp;&nbsp;&nbsp;&nbsp;&nbsp;&nbsp;&nbsp;[&#160;<a href="javascript:void(0);" onclick="javascript: window.open('/scielo.php?script=sci_nlinks&ref=3667473&pid=S0212-1611201200020003300003&lng=','','width=640,height=500,resizable=yes,scrollbars=1,menubar=yes,');">Links</a>&#160;]<!-- end-ref --></font></p>    <!-- ref --><p><font face="Verdana" size="2">4. Bistrian BR, Blackburn GL, Vitale J, Cochran D, Naylor J. Prevalence of malnutrition in general medical patients. <i>JAMA</i> 1976; 235: 1567-1570.    &nbsp;&nbsp;&nbsp;&nbsp;&nbsp;&nbsp;&nbsp;&nbsp;[&#160;<a href="javascript:void(0);" onclick="javascript: window.open('/scielo.php?script=sci_nlinks&ref=3667475&pid=S0212-1611201200020003300004&lng=','','width=640,height=500,resizable=yes,scrollbars=1,menubar=yes,');">Links</a>&#160;]<!-- end-ref --></font></p>    ]]></body>
<body><![CDATA[<!-- ref --><p><font face="Verdana" size="2">5. Kamath SK, Lawer M, Smith AE, Kalat T, Smith AR. Hospital malnutrition: a 33-hospital screening study. <i>J Am Diet Assoc</i> 1986; 86: 203-6.    &nbsp;&nbsp;&nbsp;&nbsp;&nbsp;&nbsp;&nbsp;&nbsp;[&#160;<a href="javascript:void(0);" onclick="javascript: window.open('/scielo.php?script=sci_nlinks&ref=3667477&pid=S0212-1611201200020003300005&lng=','','width=640,height=500,resizable=yes,scrollbars=1,menubar=yes,');">Links</a>&#160;]<!-- end-ref --></font></p>    <!-- ref --><p><font face="Verdana" size="2">6. Lamb CA, Parr J, Lamb EI, Warren MD. Adult malnutrition screening, prevalence and management in a United Kingdom hospital: cross-sectional study. <i>Br J Nutr</i> 2009; 102 (4): 571-5.    &nbsp;&nbsp;&nbsp;&nbsp;&nbsp;&nbsp;&nbsp;&nbsp;[&#160;<a href="javascript:void(0);" onclick="javascript: window.open('/scielo.php?script=sci_nlinks&ref=3667479&pid=S0212-1611201200020003300006&lng=','','width=640,height=500,resizable=yes,scrollbars=1,menubar=yes,');">Links</a>&#160;]<!-- end-ref --></font></p>    <!-- ref --><p><font face="Verdana" size="2">7. Libro Blanco: <a target="_blank" href="http://www.senpe.com/IMS/publicaciones/libros/senpe_libro_blanco_desnutricion_05.pdf">http://www.senpe.com/IMS/publicaciones/libros/senpe_libro_blanco_desnutricion_05.pdf</a> (en español)</font>&nbsp;&nbsp;&nbsp;&nbsp;&nbsp;&nbsp;&nbsp;&nbsp;[&#160;<a href="javascript:void(0);" onclick="javascript: window.open('/scielo.php?script=sci_nlinks&ref=3667481&pid=S0212-1611201200020003300007&lng=','','width=640,height=500,resizable=yes,scrollbars=1,menubar=yes,');">Links</a>&#160;]<!-- end-ref --><!-- ref --><p><font face="Verdana" size="2">8. Jie B, Jiang ZM, Nolan MT, Efron DT, Zhu SN, Yu K, Kondrup J. Impact of nutritional support on clinical outcomes in patients at nutritional risk: A multicentre, prospective cohort study in Baltimore and Beijing teaching hospitals. <i>Nutrition</i> 2010; 26 (10-11): 1088-93.    &nbsp;&nbsp;&nbsp;&nbsp;&nbsp;&nbsp;&nbsp;&nbsp;[&#160;<a href="javascript:void(0);" onclick="javascript: window.open('/scielo.php?script=sci_nlinks&ref=3667482&pid=S0212-1611201200020003300008&lng=','','width=640,height=500,resizable=yes,scrollbars=1,menubar=yes,');">Links</a>&#160;]<!-- end-ref --></font></p>    <!-- ref --><p><font face="Verdana" size="2">9. Strickland A, Brogan A, Krauss J, Martindale R, Cresci G . Is the use of specialized nutritional formulations a cost-effective strategy? A national database evaluation. <i>JPEN</i> 2005; 29 (1 Suppl.): S81-S91.    &nbsp;&nbsp;&nbsp;&nbsp;&nbsp;&nbsp;&nbsp;&nbsp;[&#160;<a href="javascript:void(0);" onclick="javascript: window.open('/scielo.php?script=sci_nlinks&ref=3667484&pid=S0212-1611201200020003300009&lng=','','width=640,height=500,resizable=yes,scrollbars=1,menubar=yes,');">Links</a>&#160;]<!-- end-ref --></font></p>    <!-- ref --><p><font face="Verdana" size="2">10. Kondrup J, Rasmussen HH, Hamberg O, Stanga Z. Nutritional risk screenig (NRS 2002): a new method based on an analysis of controlled clinical trials. <i>Clin Nutr</i> 2003; 22: 321-336.    &nbsp;&nbsp;&nbsp;&nbsp;&nbsp;&nbsp;&nbsp;&nbsp;[&#160;<a href="javascript:void(0);" onclick="javascript: window.open('/scielo.php?script=sci_nlinks&ref=3667486&pid=S0212-1611201200020003300010&lng=','','width=640,height=500,resizable=yes,scrollbars=1,menubar=yes,');">Links</a>&#160;]<!-- end-ref --></font></p>    <!-- ref --><p><font face="Verdana" size="2">11. Vellas B, Guigoz Y, Garry PJ, Nourhashemi F, Bennahum D, Lauque S, Albarede JL. The Mini Nutritional Assessment (MNA) and its use in grading the nutritional state of elderly patients. <i>Nutrition</i> 1999; 15: 116-22.    &nbsp;&nbsp;&nbsp;&nbsp;&nbsp;&nbsp;&nbsp;&nbsp;[&#160;<a href="javascript:void(0);" onclick="javascript: window.open('/scielo.php?script=sci_nlinks&ref=3667488&pid=S0212-1611201200020003300011&lng=','','width=640,height=500,resizable=yes,scrollbars=1,menubar=yes,');">Links</a>&#160;]<!-- end-ref --></font></p>    <!-- ref --><p><font face="Verdana" size="2">12. Malnutrition Advisory Group. A consistent and reliable tool for malnutrition screening. <i>Nurs Times</i> 2003; 99 (46): 26-7.    &nbsp;&nbsp;&nbsp;&nbsp;&nbsp;&nbsp;&nbsp;&nbsp;[&#160;<a href="javascript:void(0);" onclick="javascript: window.open('/scielo.php?script=sci_nlinks&ref=3667490&pid=S0212-1611201200020003300012&lng=','','width=640,height=500,resizable=yes,scrollbars=1,menubar=yes,');">Links</a>&#160;]<!-- end-ref --></font></p>    <!-- ref --><p><font face="Verdana" size="2">13. Detsky AS, McLaughlin JR, Baker JP, Johnston N, Whittaker S, Mendelson RA, Jeejeebhoy KN. What is subjective global assessment of nutritional status? <i>JPEN J Parenter Enteral Nutr</i> 1987; 11: 8-13.    &nbsp;&nbsp;&nbsp;&nbsp;&nbsp;&nbsp;&nbsp;&nbsp;[&#160;<a href="javascript:void(0);" onclick="javascript: window.open('/scielo.php?script=sci_nlinks&ref=3667492&pid=S0212-1611201200020003300013&lng=','','width=640,height=500,resizable=yes,scrollbars=1,menubar=yes,');">Links</a>&#160;]<!-- end-ref --></font></p>    <!-- ref --><p><font face="Verdana" size="2">14. Resolution ResAP(2003)3 on food and nutritional care in hospitals. <a target="_blank" href="http://www.nutritionday.org/uploads/media/Resolution_of_the_Council_of_Europe.pdf">http://www.nutritionday.org/uploads/media/Resolution_of_the_Council_of_Europe.pdf</a></font>&nbsp;&nbsp;&nbsp;&nbsp;&nbsp;&nbsp;&nbsp;&nbsp;[&#160;<a href="javascript:void(0);" onclick="javascript: window.open('/scielo.php?script=sci_nlinks&ref=3667494&pid=S0212-1611201200020003300014&lng=','','width=640,height=500,resizable=yes,scrollbars=1,menubar=yes,');">Links</a>&#160;]<!-- end-ref --><!-- ref --><p><font face="Verdana" size="2">15. Ulíbarri JI, González-Madroño A, De Villar NGP, González P, González B, Mancha A, Rodríguez F, Fernández G. CONUT: A tool for Controlling Nutritional Status. First Validation in a hospital population. <i>Nutr Hosp</i> 2005; 20 (1): 38-45.    &nbsp;&nbsp;&nbsp;&nbsp;&nbsp;&nbsp;&nbsp;&nbsp;[&#160;<a href="javascript:void(0);" onclick="javascript: window.open('/scielo.php?script=sci_nlinks&ref=3667495&pid=S0212-1611201200020003300015&lng=','','width=640,height=500,resizable=yes,scrollbars=1,menubar=yes,');">Links</a>&#160;]<!-- end-ref --></font></p>    ]]></body>
<body><![CDATA[<!-- ref --><p><font face="Verdana" size="2">16. Brugler L, Stankovic AK, Schlefer M, Bernstein L.St. Francis Hospital, Wilmington, Delaware, USA. A simplified nutrition screen for hospitalized patients using readily available laboratory and patient information. <i>Nutrition</i> 2005; 21 (6): 650-8.    &nbsp;&nbsp;&nbsp;&nbsp;&nbsp;&nbsp;&nbsp;&nbsp;[&#160;<a href="javascript:void(0);" onclick="javascript: window.open('/scielo.php?script=sci_nlinks&ref=3667497&pid=S0212-1611201200020003300016&lng=','','width=640,height=500,resizable=yes,scrollbars=1,menubar=yes,');">Links</a>&#160;]<!-- end-ref --></font></p>    <!-- ref --><p><font face="Verdana" size="2">17. González Madroño A, Mancha A, Rodríguez FJ, De Ulibarri JI, Culebras J. The use of biochemical and immunological parameters in nutritional screening and assessment. <i>Nutr Hosp</i> 2011; 26: 594-601.    &nbsp;&nbsp;&nbsp;&nbsp;&nbsp;&nbsp;&nbsp;&nbsp;[&#160;<a href="javascript:void(0);" onclick="javascript: window.open('/scielo.php?script=sci_nlinks&ref=3667499&pid=S0212-1611201200020003300017&lng=','','width=640,height=500,resizable=yes,scrollbars=1,menubar=yes,');">Links</a>&#160;]<!-- end-ref --></font></p>    <!-- ref --><p><font face="Verdana" size="2">18. Gibbs J, Cull W, Henderson W, Daley J, Hur K, Khuri SF. Preoperative serum albumin level as a predictor of operative mortality and morbidity: results from the National VA Surgical Risk Study. <i>Arch Surg</i> 1999; 134: 36-42.    &nbsp;&nbsp;&nbsp;&nbsp;&nbsp;&nbsp;&nbsp;&nbsp;[&#160;<a href="javascript:void(0);" onclick="javascript: window.open('/scielo.php?script=sci_nlinks&ref=3667501&pid=S0212-1611201200020003300018&lng=','','width=640,height=500,resizable=yes,scrollbars=1,menubar=yes,');">Links</a>&#160;]<!-- end-ref --></font></p>    <!-- ref --><p><font face="Verdana" size="2">19. Harvey KB, Moldawer LL, Bristian BR, Blacburn GL. Biological maesures for the formulations of a prognostic index. <i>Am J Clin Nutr</i> 1981; 34: 2013-22.    &nbsp;&nbsp;&nbsp;&nbsp;&nbsp;&nbsp;&nbsp;&nbsp;[&#160;<a href="javascript:void(0);" onclick="javascript: window.open('/scielo.php?script=sci_nlinks&ref=3667503&pid=S0212-1611201200020003300019&lng=','','width=640,height=500,resizable=yes,scrollbars=1,menubar=yes,');">Links</a>&#160;]<!-- end-ref --></font></p>    <!-- ref --><p><font face="Verdana" size="2">20. Sullivan DH, Walls RC, Bopp MM. Protein- energy undernutrtion and the risk of mortality within one year of hospital discharge: a follow up study. <i>J Am Geriatr Soc</i> 1995; 43: 507-12.    &nbsp;&nbsp;&nbsp;&nbsp;&nbsp;&nbsp;&nbsp;&nbsp;[&#160;<a href="javascript:void(0);" onclick="javascript: window.open('/scielo.php?script=sci_nlinks&ref=3667505&pid=S0212-1611201200020003300020&lng=','','width=640,height=500,resizable=yes,scrollbars=1,menubar=yes,');">Links</a>&#160;]<!-- end-ref --></font></p>    ]]></body>
<body><![CDATA[<!-- ref --><p><font face="Verdana" size="2">21. López-Martínez J, Sanchez-Castilla M, García-de-Lorenzo A. Hypocholesterolemia in critically ill patients. <i>Intensive Care Med</i> 2000, 26: 259-60.    &nbsp;&nbsp;&nbsp;&nbsp;&nbsp;&nbsp;&nbsp;&nbsp;[&#160;<a href="javascript:void(0);" onclick="javascript: window.open('/scielo.php?script=sci_nlinks&ref=3667507&pid=S0212-1611201200020003300021&lng=','','width=640,height=500,resizable=yes,scrollbars=1,menubar=yes,');">Links</a>&#160;]<!-- end-ref --></font></p>    <!-- ref --><p><font face="Verdana" size="2">22. Reuben DB, Ix JH, Grendale GA et al. The predictive value of combined Hypoalbuminemia and hypocholesterolemia in high functioning community-dwelling older persons: Mac Arthur Studies of succesful aging. <i>J Am Geriatr Soc</i> 1999; 47: 402-6.    &nbsp;&nbsp;&nbsp;&nbsp;&nbsp;&nbsp;&nbsp;&nbsp;[&#160;<a href="javascript:void(0);" onclick="javascript: window.open('/scielo.php?script=sci_nlinks&ref=3667509&pid=S0212-1611201200020003300022&lng=','','width=640,height=500,resizable=yes,scrollbars=1,menubar=yes,');">Links</a>&#160;]<!-- end-ref --></font></p>    <!-- ref --><p><font face="Verdana" size="2">23. Shronts EP. Basic concepts of inmunology and its aplication to clinical nutrition. <i>Nutr Clin Pract</i> 1993; 8: 177-83.    &nbsp;&nbsp;&nbsp;&nbsp;&nbsp;&nbsp;&nbsp;&nbsp;[&#160;<a href="javascript:void(0);" onclick="javascript: window.open('/scielo.php?script=sci_nlinks&ref=3667511&pid=S0212-1611201200020003300023&lng=','','width=640,height=500,resizable=yes,scrollbars=1,menubar=yes,');">Links</a>&#160;]<!-- end-ref --></font></p>    <!-- ref --><p><font face="Verdana" size="2">24. Casey J, Flinn WR, Yao JS et al. Correlation of inmune and nutritional status with wound complications in patients undergoing vascular operations. <i>Surgery</i> 1983; 93: 822-7.    &nbsp;&nbsp;&nbsp;&nbsp;&nbsp;&nbsp;&nbsp;&nbsp;[&#160;<a href="javascript:void(0);" onclick="javascript: window.open('/scielo.php?script=sci_nlinks&ref=3667513&pid=S0212-1611201200020003300024&lng=','','width=640,height=500,resizable=yes,scrollbars=1,menubar=yes,');">Links</a>&#160;]<!-- end-ref --></font></p>    <!-- ref --><p><font face="Verdana" size="2">25. Omran ML, Morley JE, Assessment of protein energy malnutrition in older persons, part II: Laboratory evaluation. <i>Nutrition</i> 2000; 16: 131-140.    &nbsp;&nbsp;&nbsp;&nbsp;&nbsp;&nbsp;&nbsp;&nbsp;[&#160;<a href="javascript:void(0);" onclick="javascript: window.open('/scielo.php?script=sci_nlinks&ref=3667515&pid=S0212-1611201200020003300025&lng=','','width=640,height=500,resizable=yes,scrollbars=1,menubar=yes,');">Links</a>&#160;]<!-- end-ref --></font></p>    ]]></body>
<body><![CDATA[<!-- ref --><p><font face="Verdana" size="2">26. García de Lorenzo A, Álvarez Hernández J. Multidisciplinary consensus on the approach to hospital malnutrition in Spain. <i>Nutr Hosp</i> 2011; 26 (4): 701-710.    &nbsp;&nbsp;&nbsp;&nbsp;&nbsp;&nbsp;&nbsp;&nbsp;[&#160;<a href="javascript:void(0);" onclick="javascript: window.open('/scielo.php?script=sci_nlinks&ref=3667517&pid=S0212-1611201200020003300026&lng=','','width=640,height=500,resizable=yes,scrollbars=1,menubar=yes,');">Links</a>&#160;]<!-- end-ref --></font></p>    <!-- ref --><p><font face="Verdana" size="2">27. Practical statistics for medical research. Altman DG. New York: Chapman and Hall; 1991.    &nbsp;&nbsp;&nbsp;&nbsp;&nbsp;&nbsp;&nbsp;&nbsp;[&#160;<a href="javascript:void(0);" onclick="javascript: window.open('/scielo.php?script=sci_nlinks&ref=3667519&pid=S0212-1611201200020003300027&lng=','','width=640,height=500,resizable=yes,scrollbars=1,menubar=yes,');">Links</a>&#160;]<!-- end-ref --></font></p>    <!-- ref --><p><font face="Verdana" size="2">28. Clinical Epidemiology. The essentials. Second Edition. Robert H. Fletcher, Suzanne W. Fletcher, Edward H. Wagner. 1988. Williams & Wilkins.    &nbsp;&nbsp;&nbsp;&nbsp;&nbsp;&nbsp;&nbsp;&nbsp;[&#160;<a href="javascript:void(0);" onclick="javascript: window.open('/scielo.php?script=sci_nlinks&ref=3667521&pid=S0212-1611201200020003300028&lng=','','width=640,height=500,resizable=yes,scrollbars=1,menubar=yes,');">Links</a>&#160;]<!-- end-ref --></font></p>     <p>&nbsp;</p>     <p>&nbsp;</p>     <p><font face="Verdana" size="2"><a href="#top"><img border="0" src="/img/revistas/nh/v27n2/seta.gif" width="15" height="17"></a><a name="bajo"></a><b>Correspondence:</b>    <br>Ana González-Madroño.    ]]></body>
<body><![CDATA[<br>Hospital Universitario de La Princesa.    <br>Sección de Nutrición Clínica y Dietética.    <br>C/ Diego de León, 62.    <br>28006 Madrid (España).    <br>E-mail: <a href="mailto:ana_madrono@yahoo.com">ana_madrono@yahoo.com</a></font></p>     <p><font face="Verdana" size="2">Recibido: 21-XI-2011.    <br>Aceptado: 22-XI-2011.</font></p>      ]]></body><back>
<ref-list>
<ref id="B1">
<label>1</label><nlm-citation citation-type="journal">
<person-group person-group-type="author">
<name>
<surname><![CDATA[Raslan]]></surname>
<given-names><![CDATA[M]]></given-names>
</name>
<name>
<surname><![CDATA[Gonzalez]]></surname>
<given-names><![CDATA[MC]]></given-names>
</name>
<name>
<surname><![CDATA[Torrinhas]]></surname>
<given-names><![CDATA[RS]]></given-names>
</name>
<name>
<surname><![CDATA[Ravacci]]></surname>
<given-names><![CDATA[GR]]></given-names>
</name>
<name>
<surname><![CDATA[Pereira]]></surname>
<given-names><![CDATA[JC]]></given-names>
</name>
<name>
<surname><![CDATA[Waitzberg]]></surname>
<given-names><![CDATA[DL]]></given-names>
</name>
</person-group>
<article-title xml:lang="en"><![CDATA[Complementarity of Subjective Global Assessment (SGA) and Nutritional Risk Screening 2002 (NRS 2002) for predicting por clinical outcomes in hospitalized patients]]></article-title>
<source><![CDATA[Clin Nutr]]></source>
<year>2011</year>
<volume>30</volume>
<numero>1</numero>
<issue>1</issue>
<page-range>49-53</page-range></nlm-citation>
</ref>
<ref id="B2">
<label>2</label><nlm-citation citation-type="journal">
<person-group person-group-type="author">
<name>
<surname><![CDATA[Beghetto]]></surname>
<given-names><![CDATA[MG]]></given-names>
</name>
<name>
<surname><![CDATA[Luft]]></surname>
<given-names><![CDATA[VC]]></given-names>
</name>
<name>
<surname><![CDATA[Mello]]></surname>
<given-names><![CDATA[ED]]></given-names>
</name>
<name>
<surname><![CDATA[Polanczyk]]></surname>
<given-names><![CDATA[CA]]></given-names>
</name>
</person-group>
<article-title xml:lang="en"><![CDATA[Accuracy of nutritional assessment tools for predicting adverse hospital outcomes]]></article-title>
<source><![CDATA[Nutr Hosp]]></source>
<year>2009</year>
<volume>24</volume>
<numero>1</numero>
<issue>1</issue>
<page-range>56-62</page-range></nlm-citation>
</ref>
<ref id="B3">
<label>3</label><nlm-citation citation-type="journal">
<person-group person-group-type="author">
<name>
<surname><![CDATA[Bistrian]]></surname>
<given-names><![CDATA[BR]]></given-names>
</name>
<name>
<surname><![CDATA[Blackburn]]></surname>
<given-names><![CDATA[GL]]></given-names>
</name>
<name>
<surname><![CDATA[Hallowell]]></surname>
<given-names><![CDATA[E]]></given-names>
</name>
<name>
<surname><![CDATA[Heddle]]></surname>
<given-names><![CDATA[R]]></given-names>
</name>
</person-group>
<article-title xml:lang="en"><![CDATA[Protein status on general surgical patients]]></article-title>
<source><![CDATA[JAMA]]></source>
<year>1974</year>
<volume>230</volume>
<page-range>858-860</page-range></nlm-citation>
</ref>
<ref id="B4">
<label>4</label><nlm-citation citation-type="journal">
<person-group person-group-type="author">
<name>
<surname><![CDATA[Bistrian]]></surname>
<given-names><![CDATA[BR]]></given-names>
</name>
<name>
<surname><![CDATA[Blackburn]]></surname>
<given-names><![CDATA[GL]]></given-names>
</name>
<name>
<surname><![CDATA[Vitale]]></surname>
<given-names><![CDATA[J]]></given-names>
</name>
<name>
<surname><![CDATA[Cochran]]></surname>
<given-names><![CDATA[D]]></given-names>
</name>
<name>
<surname><![CDATA[Naylor]]></surname>
<given-names><![CDATA[J]]></given-names>
</name>
</person-group>
<article-title xml:lang="en"><![CDATA[Prevalence of malnutrition in general medical patients]]></article-title>
<source><![CDATA[JAMA]]></source>
<year>1976</year>
<volume>235</volume>
<page-range>1567-1570</page-range></nlm-citation>
</ref>
<ref id="B5">
<label>5</label><nlm-citation citation-type="journal">
<person-group person-group-type="author">
<name>
<surname><![CDATA[Kamath]]></surname>
<given-names><![CDATA[SK]]></given-names>
</name>
<name>
<surname><![CDATA[Lawer]]></surname>
<given-names><![CDATA[M]]></given-names>
</name>
<name>
<surname><![CDATA[Smith]]></surname>
<given-names><![CDATA[AE]]></given-names>
</name>
<name>
<surname><![CDATA[Kalat]]></surname>
<given-names><![CDATA[T]]></given-names>
</name>
<name>
<surname><![CDATA[Smith]]></surname>
<given-names><![CDATA[AR]]></given-names>
</name>
</person-group>
<article-title xml:lang="en"><![CDATA[Hospital malnutrition: a 33-hospital screening study]]></article-title>
<source><![CDATA[J Am Diet Assoc]]></source>
<year>1986</year>
<volume>86</volume>
<page-range>203-6</page-range></nlm-citation>
</ref>
<ref id="B6">
<label>6</label><nlm-citation citation-type="journal">
<person-group person-group-type="author">
<name>
<surname><![CDATA[Lamb]]></surname>
<given-names><![CDATA[CA]]></given-names>
</name>
<name>
<surname><![CDATA[Parr]]></surname>
<given-names><![CDATA[J]]></given-names>
</name>
<name>
<surname><![CDATA[Lamb]]></surname>
<given-names><![CDATA[EI]]></given-names>
</name>
<name>
<surname><![CDATA[Warren]]></surname>
<given-names><![CDATA[MD]]></given-names>
</name>
</person-group>
<article-title xml:lang="en"><![CDATA[Adult malnutrition screening, prevalence and management in a United Kingdom hospital: cross-sectional study]]></article-title>
<source><![CDATA[Br J Nutr]]></source>
<year>2009</year>
<volume>102</volume>
<numero>4</numero>
<issue>4</issue>
<page-range>571-5</page-range></nlm-citation>
</ref>
<ref id="B7">
<label>7</label><nlm-citation citation-type="">
<source><![CDATA[Libro Blanco]]></source>
<year></year>
</nlm-citation>
</ref>
<ref id="B8">
<label>8</label><nlm-citation citation-type="journal">
<person-group person-group-type="author">
<name>
<surname><![CDATA[Jie]]></surname>
<given-names><![CDATA[B]]></given-names>
</name>
<name>
<surname><![CDATA[Jiang]]></surname>
<given-names><![CDATA[ZM]]></given-names>
</name>
<name>
<surname><![CDATA[Nolan]]></surname>
<given-names><![CDATA[MT]]></given-names>
</name>
<name>
<surname><![CDATA[Efron]]></surname>
<given-names><![CDATA[DT]]></given-names>
</name>
<name>
<surname><![CDATA[Zhu]]></surname>
<given-names><![CDATA[SN]]></given-names>
</name>
<name>
<surname><![CDATA[Yu]]></surname>
<given-names><![CDATA[K]]></given-names>
</name>
<name>
<surname><![CDATA[Kondrup]]></surname>
<given-names><![CDATA[J]]></given-names>
</name>
</person-group>
<article-title xml:lang="en"><![CDATA[Impact of nutritional support on clinical outcomes in patients at nutritional risk: A multicentre, prospective cohort study in Baltimore and Beijing teaching hospitals]]></article-title>
<source><![CDATA[Nutrition]]></source>
<year>2010</year>
<volume>26</volume>
<numero>10-11</numero>
<issue>10-11</issue>
<page-range>1088-93</page-range></nlm-citation>
</ref>
<ref id="B9">
<label>9</label><nlm-citation citation-type="journal">
<person-group person-group-type="author">
<name>
<surname><![CDATA[Strickland]]></surname>
<given-names><![CDATA[A]]></given-names>
</name>
<name>
<surname><![CDATA[Brogan]]></surname>
<given-names><![CDATA[A]]></given-names>
</name>
<name>
<surname><![CDATA[Krauss]]></surname>
<given-names><![CDATA[J]]></given-names>
</name>
<name>
<surname><![CDATA[Martindale]]></surname>
<given-names><![CDATA[R]]></given-names>
</name>
<name>
<surname><![CDATA[Cresci]]></surname>
<given-names><![CDATA[G]]></given-names>
</name>
</person-group>
<article-title xml:lang="en"><![CDATA[Is the use of specialized nutritional formulations a cost-effective strategy?: A national database evaluation]]></article-title>
<source><![CDATA[JPEN]]></source>
<year>2005</year>
<volume>29</volume>
<numero>1</numero>
<issue>1</issue>
<page-range>S81-S91</page-range></nlm-citation>
</ref>
<ref id="B10">
<label>10</label><nlm-citation citation-type="journal">
<person-group person-group-type="author">
<name>
<surname><![CDATA[Kondrup]]></surname>
<given-names><![CDATA[J]]></given-names>
</name>
<name>
<surname><![CDATA[Rasmussen]]></surname>
<given-names><![CDATA[HH]]></given-names>
</name>
<name>
<surname><![CDATA[Hamberg]]></surname>
<given-names><![CDATA[O]]></given-names>
</name>
<name>
<surname><![CDATA[Stanga]]></surname>
<given-names><![CDATA[Z]]></given-names>
</name>
</person-group>
<article-title xml:lang="en"><![CDATA[Nutritional risk screenig (NRS 2002): a new method based on an analysis of controlled clinical trials]]></article-title>
<source><![CDATA[Clin Nutr]]></source>
<year>2003</year>
<volume>22</volume>
<page-range>321-336</page-range></nlm-citation>
</ref>
<ref id="B11">
<label>11</label><nlm-citation citation-type="journal">
<person-group person-group-type="author">
<name>
<surname><![CDATA[Vellas]]></surname>
<given-names><![CDATA[B]]></given-names>
</name>
<name>
<surname><![CDATA[Guigoz]]></surname>
<given-names><![CDATA[Y]]></given-names>
</name>
<name>
<surname><![CDATA[Garry]]></surname>
<given-names><![CDATA[PJ]]></given-names>
</name>
<name>
<surname><![CDATA[Nourhashemi]]></surname>
<given-names><![CDATA[F]]></given-names>
</name>
<name>
<surname><![CDATA[Bennahum]]></surname>
<given-names><![CDATA[D]]></given-names>
</name>
<name>
<surname><![CDATA[Lauque]]></surname>
<given-names><![CDATA[S]]></given-names>
</name>
<name>
<surname><![CDATA[Albarede]]></surname>
<given-names><![CDATA[JL]]></given-names>
</name>
</person-group>
<article-title xml:lang="en"><![CDATA[The Mini Nutritional Assessment (MNA) and its use in grading the nutritional state of elderly patients]]></article-title>
<source><![CDATA[Nutrition]]></source>
<year>1999</year>
<volume>15</volume>
<page-range>116-22</page-range></nlm-citation>
</ref>
<ref id="B12">
<label>12</label><nlm-citation citation-type="journal">
<collab>Malnutrition Advisory Group</collab>
<article-title xml:lang="en"><![CDATA[A consistent and reliable tool for malnutrition screening]]></article-title>
<source><![CDATA[Nurs Times]]></source>
<year>2003</year>
<volume>99</volume>
<numero>46</numero>
<issue>46</issue>
<page-range>26-7</page-range></nlm-citation>
</ref>
<ref id="B13">
<label>13</label><nlm-citation citation-type="journal">
<person-group person-group-type="author">
<name>
<surname><![CDATA[Detsky]]></surname>
<given-names><![CDATA[AS]]></given-names>
</name>
<name>
<surname><![CDATA[McLaughlin]]></surname>
<given-names><![CDATA[JR]]></given-names>
</name>
<name>
<surname><![CDATA[Baker]]></surname>
<given-names><![CDATA[JP]]></given-names>
</name>
<name>
<surname><![CDATA[Johnston]]></surname>
<given-names><![CDATA[N]]></given-names>
</name>
<name>
<surname><![CDATA[Whittaker]]></surname>
<given-names><![CDATA[S]]></given-names>
</name>
<name>
<surname><![CDATA[Mendelson]]></surname>
<given-names><![CDATA[RA]]></given-names>
</name>
<name>
<surname><![CDATA[Jeejeebhoy]]></surname>
<given-names><![CDATA[KN]]></given-names>
</name>
</person-group>
<article-title xml:lang="en"><![CDATA[What is subjective global assessment of nutritional status?]]></article-title>
<source><![CDATA[JPEN J Parenter Enteral Nutr]]></source>
<year>1987</year>
<volume>11</volume>
<page-range>8-13</page-range></nlm-citation>
</ref>
<ref id="B14">
<label>14</label><nlm-citation citation-type="">
<source><![CDATA[Resolution ResAP(2003)3 on food and nutritional care in hospitals]]></source>
<year></year>
</nlm-citation>
</ref>
<ref id="B15">
<label>15</label><nlm-citation citation-type="journal">
<person-group person-group-type="author">
<name>
<surname><![CDATA[Ulíbarri]]></surname>
<given-names><![CDATA[JI]]></given-names>
</name>
<name>
<surname><![CDATA[González-Madroño]]></surname>
<given-names><![CDATA[A]]></given-names>
</name>
<name>
<surname><![CDATA[De Villar]]></surname>
<given-names><![CDATA[NGP]]></given-names>
</name>
<name>
<surname><![CDATA[González]]></surname>
<given-names><![CDATA[P]]></given-names>
</name>
<name>
<surname><![CDATA[González]]></surname>
<given-names><![CDATA[B]]></given-names>
</name>
<name>
<surname><![CDATA[Mancha]]></surname>
<given-names><![CDATA[A]]></given-names>
</name>
<name>
<surname><![CDATA[Rodríguez]]></surname>
<given-names><![CDATA[F]]></given-names>
</name>
<name>
<surname><![CDATA[Fernández]]></surname>
<given-names><![CDATA[G]]></given-names>
</name>
</person-group>
<article-title xml:lang="en"><![CDATA[CONUT: A tool for Controlling Nutritional Status. First Validation in a hospital population]]></article-title>
<source><![CDATA[Nutr Hosp]]></source>
<year>2005</year>
<volume>20</volume>
<numero>1</numero>
<issue>1</issue>
<page-range>38-45</page-range></nlm-citation>
</ref>
<ref id="B16">
<label>16</label><nlm-citation citation-type="journal">
<person-group person-group-type="author">
<name>
<surname><![CDATA[Brugler]]></surname>
<given-names><![CDATA[L]]></given-names>
</name>
<name>
<surname><![CDATA[Stankovic]]></surname>
<given-names><![CDATA[AK]]></given-names>
</name>
<name>
<surname><![CDATA[Schlefer]]></surname>
<given-names><![CDATA[M]]></given-names>
</name>
<name>
<surname><![CDATA[Bernstein]]></surname>
<given-names><![CDATA[L]]></given-names>
</name>
</person-group>
<article-title xml:lang="en"><![CDATA[A simplified nutrition screen for hospitalized patients using readily available laboratory and patient information]]></article-title>
<source><![CDATA[Nutrition]]></source>
<year>2005</year>
<volume>21</volume>
<numero>6</numero>
<issue>6</issue>
<page-range>650-8</page-range></nlm-citation>
</ref>
<ref id="B17">
<label>17</label><nlm-citation citation-type="journal">
<person-group person-group-type="author">
<name>
<surname><![CDATA[González Madroño]]></surname>
<given-names><![CDATA[A]]></given-names>
</name>
<name>
<surname><![CDATA[Mancha]]></surname>
<given-names><![CDATA[A]]></given-names>
</name>
<name>
<surname><![CDATA[Rodríguez]]></surname>
<given-names><![CDATA[FJ]]></given-names>
</name>
<name>
<surname><![CDATA[De Ulibarri]]></surname>
<given-names><![CDATA[JI]]></given-names>
</name>
<name>
<surname><![CDATA[Culebras]]></surname>
<given-names><![CDATA[J]]></given-names>
</name>
</person-group>
<article-title xml:lang="en"><![CDATA[The use of biochemical and immunological parameters in nutritional screening and assessment]]></article-title>
<source><![CDATA[Nutr Hosp]]></source>
<year>2011</year>
<volume>26</volume>
<page-range>594-601</page-range></nlm-citation>
</ref>
<ref id="B18">
<label>18</label><nlm-citation citation-type="journal">
<person-group person-group-type="author">
<name>
<surname><![CDATA[Gibbs]]></surname>
<given-names><![CDATA[J]]></given-names>
</name>
<name>
<surname><![CDATA[Cull]]></surname>
<given-names><![CDATA[W]]></given-names>
</name>
<name>
<surname><![CDATA[Henderson]]></surname>
<given-names><![CDATA[W]]></given-names>
</name>
<name>
<surname><![CDATA[Daley]]></surname>
<given-names><![CDATA[J]]></given-names>
</name>
<name>
<surname><![CDATA[Hur]]></surname>
<given-names><![CDATA[K]]></given-names>
</name>
<name>
<surname><![CDATA[Khuri]]></surname>
<given-names><![CDATA[SF]]></given-names>
</name>
</person-group>
<article-title xml:lang="en"><![CDATA[Preoperative serum albumin level as a predictor of operative mortality and morbidity: results from the National VA Surgical Risk Study]]></article-title>
<source><![CDATA[Arch Surg]]></source>
<year>1999</year>
<volume>134</volume>
<page-range>36-42</page-range></nlm-citation>
</ref>
<ref id="B19">
<label>19</label><nlm-citation citation-type="journal">
<person-group person-group-type="author">
<name>
<surname><![CDATA[Harvey]]></surname>
<given-names><![CDATA[KB]]></given-names>
</name>
<name>
<surname><![CDATA[Moldawer]]></surname>
<given-names><![CDATA[LL]]></given-names>
</name>
<name>
<surname><![CDATA[Bristian]]></surname>
<given-names><![CDATA[BR]]></given-names>
</name>
<name>
<surname><![CDATA[Blacburn]]></surname>
<given-names><![CDATA[GL]]></given-names>
</name>
</person-group>
<article-title xml:lang="en"><![CDATA[Biological maesures for the formulations of a prognostic index]]></article-title>
<source><![CDATA[Am J Clin Nutr]]></source>
<year>1981</year>
<volume>34</volume>
<page-range>2013-22</page-range></nlm-citation>
</ref>
<ref id="B20">
<label>20</label><nlm-citation citation-type="journal">
<person-group person-group-type="author">
<name>
<surname><![CDATA[Sullivan]]></surname>
<given-names><![CDATA[DH]]></given-names>
</name>
<name>
<surname><![CDATA[Walls]]></surname>
<given-names><![CDATA[RC]]></given-names>
</name>
<name>
<surname><![CDATA[Bopp]]></surname>
<given-names><![CDATA[MM]]></given-names>
</name>
</person-group>
<article-title xml:lang="en"><![CDATA[Protein- energy undernutrtion and the risk of mortality within one year of hospital discharge: a follow up study]]></article-title>
<source><![CDATA[J Am Geriatr Soc]]></source>
<year>1995</year>
<volume>43</volume>
<page-range>507-12</page-range></nlm-citation>
</ref>
<ref id="B21">
<label>21</label><nlm-citation citation-type="journal">
<person-group person-group-type="author">
<name>
<surname><![CDATA[López-Martínez]]></surname>
<given-names><![CDATA[J]]></given-names>
</name>
<name>
<surname><![CDATA[Sanchez-Castilla]]></surname>
<given-names><![CDATA[M]]></given-names>
</name>
<name>
<surname><![CDATA[García-de-Lorenzo]]></surname>
<given-names><![CDATA[A]]></given-names>
</name>
</person-group>
<article-title xml:lang="en"><![CDATA[Hypocholesterolemia in critically ill patients]]></article-title>
<source><![CDATA[Intensive Care Med]]></source>
<year>2000</year>
<volume>26</volume>
<page-range>259-60</page-range></nlm-citation>
</ref>
<ref id="B22">
<label>22</label><nlm-citation citation-type="journal">
<person-group person-group-type="author">
<name>
<surname><![CDATA[Reuben]]></surname>
<given-names><![CDATA[DB]]></given-names>
</name>
<name>
<surname><![CDATA[Ix]]></surname>
<given-names><![CDATA[JH]]></given-names>
</name>
<name>
<surname><![CDATA[Grendale]]></surname>
<given-names><![CDATA[GA]]></given-names>
</name>
</person-group>
<article-title xml:lang="en"><![CDATA[The predictive value of combined Hypoalbuminemia and hypocholesterolemia in high functioning community-dwelling older persons: Mac Arthur Studies of succesful aging]]></article-title>
<source><![CDATA[J Am Geriatr Soc]]></source>
<year>1999</year>
<volume>47</volume>
<page-range>402-6</page-range></nlm-citation>
</ref>
<ref id="B23">
<label>23</label><nlm-citation citation-type="journal">
<person-group person-group-type="author">
<name>
<surname><![CDATA[Shronts]]></surname>
<given-names><![CDATA[EP]]></given-names>
</name>
</person-group>
<article-title xml:lang="en"><![CDATA[Basic concepts of inmunology and its aplication to clinical nutrition]]></article-title>
<source><![CDATA[Nutr Clin Pract]]></source>
<year>1993</year>
<volume>8</volume>
<page-range>177-83</page-range></nlm-citation>
</ref>
<ref id="B24">
<label>24</label><nlm-citation citation-type="journal">
<person-group person-group-type="author">
<name>
<surname><![CDATA[Casey]]></surname>
<given-names><![CDATA[J]]></given-names>
</name>
<name>
<surname><![CDATA[Flinn]]></surname>
<given-names><![CDATA[WR]]></given-names>
</name>
<name>
<surname><![CDATA[Yao]]></surname>
<given-names><![CDATA[JS]]></given-names>
</name>
</person-group>
<article-title xml:lang="en"><![CDATA[Correlation of inmune and nutritional status with wound complications in patients undergoing vascular operations]]></article-title>
<source><![CDATA[Surgery]]></source>
<year>1983</year>
<volume>93</volume>
<page-range>822-7</page-range></nlm-citation>
</ref>
<ref id="B25">
<label>25</label><nlm-citation citation-type="journal">
<person-group person-group-type="author">
<name>
<surname><![CDATA[Omran]]></surname>
<given-names><![CDATA[ML]]></given-names>
</name>
<name>
<surname><![CDATA[Morley]]></surname>
<given-names><![CDATA[JE]]></given-names>
</name>
</person-group>
<article-title xml:lang="en"><![CDATA[Assessment of protein energy malnutrition in older persons: part II: Laboratory evaluation]]></article-title>
<source><![CDATA[Nutrition]]></source>
<year>2000</year>
<volume>16</volume>
<page-range>131-140</page-range></nlm-citation>
</ref>
<ref id="B26">
<label>26</label><nlm-citation citation-type="journal">
<person-group person-group-type="author">
<name>
<surname><![CDATA[García de Lorenzo]]></surname>
<given-names><![CDATA[A]]></given-names>
</name>
<name>
<surname><![CDATA[Álvarez Hernández]]></surname>
<given-names><![CDATA[J]]></given-names>
</name>
</person-group>
<article-title xml:lang="en"><![CDATA[Multidisciplinary consensus on the approach to hospital malnutrition in Spain]]></article-title>
<source><![CDATA[Nutr Hosp]]></source>
<year>2011</year>
<volume>26</volume>
<numero>4</numero>
<issue>4</issue>
<page-range>701-710</page-range></nlm-citation>
</ref>
<ref id="B27">
<label>27</label><nlm-citation citation-type="book">
<person-group person-group-type="author">
<name>
<surname><![CDATA[Altman]]></surname>
<given-names><![CDATA[DG]]></given-names>
</name>
</person-group>
<source><![CDATA[Practical statistics for medical research]]></source>
<year>1991</year>
<publisher-loc><![CDATA[New York ]]></publisher-loc>
<publisher-name><![CDATA[Chapman and Hall]]></publisher-name>
</nlm-citation>
</ref>
<ref id="B28">
<label>28</label><nlm-citation citation-type="book">
<person-group person-group-type="author">
<name>
<surname><![CDATA[Fletcher]]></surname>
<given-names><![CDATA[Robert H.]]></given-names>
</name>
<name>
<surname><![CDATA[Fletcher]]></surname>
<given-names><![CDATA[Suzanne W.]]></given-names>
</name>
<name>
<surname><![CDATA[Wagner]]></surname>
<given-names><![CDATA[Edward H.]]></given-names>
</name>
</person-group>
<source><![CDATA[Clinical Epidemiology: The essentials]]></source>
<year>1988</year>
<publisher-name><![CDATA[Williams & Wilkins]]></publisher-name>
</nlm-citation>
</ref>
</ref-list>
</back>
</article>
