<?xml version="1.0" encoding="ISO-8859-1"?><article xmlns:mml="http://www.w3.org/1998/Math/MathML" xmlns:xlink="http://www.w3.org/1999/xlink" xmlns:xsi="http://www.w3.org/2001/XMLSchema-instance">
<front>
<journal-meta>
<journal-id>0213-9111</journal-id>
<journal-title><![CDATA[Gaceta Sanitaria]]></journal-title>
<abbrev-journal-title><![CDATA[Gac Sanit]]></abbrev-journal-title>
<issn>0213-9111</issn>
<publisher>
<publisher-name><![CDATA[Sociedad Española de Salud Pública y Administración Sanitaria (SESPAS)]]></publisher-name>
</publisher>
</journal-meta>
<article-meta>
<article-id>S0213-91112009000300004</article-id>
<title-group>
<article-title xml:lang="en"><![CDATA[A sampling design for a Sentinel General Practitioner Network]]></article-title>
<article-title xml:lang="es"><![CDATA[Diseño de selección de muestra para una red de medicos centinela]]></article-title>
</title-group>
<contrib-group>
<contrib contrib-type="author">
<name>
<surname><![CDATA[Pérez-Farinós]]></surname>
<given-names><![CDATA[Napoleón]]></given-names>
</name>
<xref ref-type="aff" rid="A01"/>
</contrib>
<contrib contrib-type="author">
<name>
<surname><![CDATA[Galán]]></surname>
<given-names><![CDATA[Iñaki]]></given-names>
</name>
<xref ref-type="aff" rid="A01"/>
</contrib>
<contrib contrib-type="author">
<name>
<surname><![CDATA[Ordobás]]></surname>
<given-names><![CDATA[María]]></given-names>
</name>
<xref ref-type="aff" rid="A01"/>
</contrib>
<contrib contrib-type="author">
<name>
<surname><![CDATA[Zorrilla]]></surname>
<given-names><![CDATA[Belén]]></given-names>
</name>
<xref ref-type="aff" rid="A01"/>
</contrib>
<contrib contrib-type="author">
<name>
<surname><![CDATA[Cantero]]></surname>
<given-names><![CDATA[José Luis]]></given-names>
</name>
<xref ref-type="aff" rid="A01"/>
</contrib>
<contrib contrib-type="author">
<name>
<surname><![CDATA[Ramírez]]></surname>
<given-names><![CDATA[Rosa]]></given-names>
</name>
<xref ref-type="aff" rid="A01"/>
</contrib>
</contrib-group>
<aff id="A01">
<institution><![CDATA[,Comunidad de Madrid Instituto de Salud Pública Servicio de Epidemiología]]></institution>
<addr-line><![CDATA[Madrid ]]></addr-line>
<country>España</country>
</aff>
<pub-date pub-type="pub">
<day>00</day>
<month>06</month>
<year>2009</year>
</pub-date>
<pub-date pub-type="epub">
<day>00</day>
<month>06</month>
<year>2009</year>
</pub-date>
<volume>23</volume>
<numero>3</numero>
<fpage>186</fpage>
<lpage>191</lpage>
<copyright-statement/>
<copyright-year/>
<self-uri xlink:href="http://scielo.isciii.es/scielo.php?script=sci_arttext&amp;pid=S0213-91112009000300004&amp;lng=en&amp;nrm=iso"></self-uri><self-uri xlink:href="http://scielo.isciii.es/scielo.php?script=sci_abstract&amp;pid=S0213-91112009000300004&amp;lng=en&amp;nrm=iso"></self-uri><self-uri xlink:href="http://scielo.isciii.es/scielo.php?script=sci_pdf&amp;pid=S0213-91112009000300004&amp;lng=en&amp;nrm=iso"></self-uri><abstract abstract-type="short" xml:lang="en"><p><![CDATA[Objective: To construct a design for probabilistic sampling of reporting physicians in sentinel networks. Methods: We performed a multi-stage sample selection study. Data on primary care physicians and their patients were obtained from the Madrid Health Institute for 2005. The geographical unit of reference was the basic health area. A factorial analysis was performed on the basis of demographic, socio-cultural and socio-occupational variables. A cluster analysis was conducted to group the 247 basic health areas into homogeneous strata, which were then tested using a discriminant analysis. The general practitioners and pediatricians needed in each stratum were selected by simple random sampling. The representativeness of the population monitored by the selected physicians was studied with respect to the population of Madrid. Results: Factorial analysis yielded five factors. Using these, 14 strata were obtained, which were shown to be homogeneous and mutually different by discriminant analysis. The minimum population that needed to be monitored consisted of 146,946 adults and 24,518 children, proportionally distributed among the respective strata. Eighty-eight general practitioners and 32 pediatricians were selected, who respectively covered populations of 154,610 and 31,336 persons representative of the general population. Conclusions: Obtaining samples through suitable designs improves the accuracy of the information gathered by health sentinel networks in epidemiologic surveillance. Ensuring the representativeness of the study population vis-à-vis the general population is essential; cluster analysis and simple random sampling are methods that meet this need. Selecting physicians by means of probabilistic methods enables the accuracy of estimates to be ascertained.]]></p></abstract>
<abstract abstract-type="short" xml:lang="es"><p><![CDATA[Objetivo: Elaborar un diseño de muestreo probabilístico de los médicos notificadores en redes centinelas sanitarias. Métodos: Estudio de muestreo multietápico. La información sobre los médicos de Atención Primaria y la población atendida procede del Instituto Madrileño de Salud para 2005. La unidad geográfica de referencia fue la Zona Básica de Salud. Partiendo de variables demográficas, socioculturales y sociolaborales, se realizó un análisis factorial. Se hizo un análisis de clusters para agrupar las 247 Zonas Básicas de Salud en estratos homogéneos. Como comprobación se realizó un análisis discriminante. Se seleccionaron los médicos necesarios en cada estrato mediante muestreo aleatorio simple. Se estudió la representatividad de la población vigilada con respecto a la población de Madrid. Resultados: Se extrajeron 5 factores mediante análisis factorial. Se obtuvieron 14 estratos, que el análisis discriminante demostró homogéneos y distintos entre sí. Se determinó que era necesario vigilar una población mínima de 146.946 adultos y 24.518 niños, distribuidos proporcionalmente en cada estrato. Se seleccionaron 88 médicos de familia y 32 pediatras, que cubrían unas poblaciones de 154.610 y 31.336 personas, representativas de la población general. Conclusiones: La obtención de muestras con un adecuado diseño asegura la validez de la información generada por redes centinelas sanitarias en la vigilancia epidemiológica. Debe buscarse la representatividad de la población estudiada con respecto a la población general. El análisis de clusters y el muestreo aleatorio simple son métodos que responden a esta necesidad. La selección de médicos mediante métodos probabilísticos permite conocer la precisión de las estimaciones.]]></p></abstract>
<kwd-group>
<kwd lng="en"><![CDATA[Sentinel surveillance]]></kwd>
<kwd lng="en"><![CDATA[Sampling studies]]></kwd>
<kwd lng="en"><![CDATA[Primary health care]]></kwd>
<kwd lng="en"><![CDATA[Cluster analysis]]></kwd>
<kwd lng="es"><![CDATA[Redes centinela]]></kwd>
<kwd lng="es"><![CDATA[Muestreo]]></kwd>
<kwd lng="es"><![CDATA[Atención primaria]]></kwd>
<kwd lng="es"><![CDATA[Análisis de clusters]]></kwd>
</kwd-group>
</article-meta>
</front><body><![CDATA[ <p><font face="Verdana" size="2"><b><a name="top"></a>ORIGINAL</b></font></p>     <p>&nbsp;</p>     <p><font face="Verdana" size="4"><b>A sampling design for a Sentinel General Practitioner Network</b></font></p>     <p><font face="Verdana" size="4"><b>Diseño de selección de muestra para una red de medicos centinela</b></font></p>     <p>&nbsp;</p>     <p>&nbsp;</p>     <p><font face="Verdana" size="2"><b>Napoleón Pérez-Farinós, Iñaki Galán, María Ordobás, Belén Zorrilla, José Luis Cantero y Rosa Ramírez</b></font></p>     <p><font face="Verdana" size="2">Servicio de Epidemiología, Instituto de Salud Pública de la Comunidad de Madrid, Madrid, España</font></p>     <p><a href="#bajo"><font face="Verdana" size="2">C</font></a><font face="Verdana" size="2"><a href="#bajo">orrespondence</a></font></p>     <p>&nbsp;</p>     ]]></body>
<body><![CDATA[<p>&nbsp;</p> <hr size="1">     <p><font face="Verdana" size="2"><b>ABSTRACT</b></font></p>     <p><font face="Verdana" size="2"><b>Objective:</b> To construct a design for probabilistic sampling of reporting physicians in sentinel networks.    <br><b>Methods:</b> We performed a multi-stage sample selection study. Data on primary care physicians and their patients were obtained from the Madrid Health Institute for 2005. The geographical unit of reference was the basic health area. A factorial analysis was performed on the basis of demographic, socio-cultural and socio-occupational variables. A cluster analysis was conducted to group the 247 basic health areas into homogeneous strata, which were then tested using a discriminant analysis. The general practitioners and pediatricians needed in each stratum were selected by simple random sampling. The representativeness of the population monitored by the selected physicians was studied with respect to the population of Madrid.    <br><b>Results:</b> Factorial analysis yielded five factors. Using these, 14 strata were obtained, which were shown to be homogeneous and mutually different by discriminant analysis. The minimum population that needed to be monitored consisted of 146,946 adults and 24,518 children, proportionally distributed among the respective strata. Eighty-eight general practitioners and 32 pediatricians were selected, who respectively covered populations of 154,610 and 31,336 persons representative of the general population.    <br><b>Conclusions:</b> Obtaining samples through suitable designs improves the accuracy of the information gathered by health sentinel networks in epidemiologic surveillance. Ensuring the representativeness of the study population vis-à-vis the general population is essential; cluster analysis and simple random sampling are methods that meet this need. Selecting physicians by means of probabilistic methods enables the accuracy of estimates to be ascertained.</font></p>     <p><font face="Verdana" size="2"><b>Key words:</b> Sentinel surveillance. Sampling studies. Primary health care. Cluster analysis.</font></p> <hr size="1">     <p><font face="Verdana" size="2"><b>RESUMEN</b></font></p>     <p><font face="Verdana" size="2"><b>Objetivo:</b> Elaborar un diseño de muestreo probabilístico de los médicos notificadores en redes centinelas sanitarias.    <br><b>Métodos:</b> Estudio de muestreo multietápico. La información sobre los médicos de Atención Primaria y la población atendida procede del Instituto Madrileño de Salud para 2005. La unidad geográfica de referencia fue la Zona Básica de Salud. Partiendo de variables demográficas, socioculturales y sociolaborales, se realizó un análisis factorial. Se hizo un análisis de clusters para agrupar las 247 Zonas Básicas de Salud en estratos homogéneos. Como comprobación se realizó un análisis discriminante. Se seleccionaron los médicos necesarios en cada estrato mediante muestreo aleatorio simple. Se estudió la representatividad de la población vigilada con respecto a la población de Madrid.    ]]></body>
<body><![CDATA[<br><b>Resultados:</b> Se extrajeron 5 factores mediante análisis factorial. Se obtuvieron 14 estratos, que el análisis discriminante demostró homogéneos y distintos entre sí. Se determinó que era necesario vigilar una población mínima de 146.946 adultos y 24.518 niños, distribuidos proporcionalmente en cada estrato. Se seleccionaron 88 médicos de familia y 32 pediatras, que cubrían unas poblaciones de 154.610 y 31.336 personas, representativas de la población general.    <br><b>Conclusiones:</b> La obtención de muestras con un adecuado diseño asegura la validez de la información generada por redes centinelas sanitarias en la vigilancia epidemiológica. Debe buscarse la representatividad de la población estudiada con respecto a la población general. El análisis de <i>clusters</i> y el muestreo aleatorio simple son métodos que responden a esta necesidad. La selección de médicos mediante métodos probabilísticos permite conocer la precisión de las estimaciones.</font></p>     <p><font face="Verdana" size="2"><b>Palabras clave:</b> Redes centinela. Muestreo. Atención primaria. Análisis de <i>clusters</i>.</font></p> <hr size="1">     <p>&nbsp;</p>     <p><font face="Verdana" size="2"><b>Introduction</b></font></p>     <p><font face="Verdana" size="2">Sentinel networks are an increasingly useful tool in epidemiological surveillance and research. Since networks were first set up in Holland<sup>1</sup> and the United Kingdom<sup>2</sup> in the 1960s, their numbers have grown worldwide and they are used in fields as diverse as communicable<sup>3-7</sup> and non-communicable disease surveillance<sup>8-11</sup> and economic assessment studies<sup>12</sup>.</font></p>     <p><font face="Verdana" size="2">In sentinel networks, a group of physicians reports cases of diseases or processes of interest, on a regular basis, generally weekly.</font></p>     <p><font face="Verdana" size="2">The Spanish National Health System offers universal health care coverage, and consequently the majority of the population tends to use public medical services. This provides a good opportunity to study population-based primary health care demand through a probabilistically obtained sample of physicians. The population attended by the sentinel physicians must be representative of the general population, if the information obtained by such a network is intended to be at all generalisable to the latter<sup>13</sup>.</font></p>     <p><font face="Verdana" size="2">At present, sentinel networks are in place in most of Spain's Autonomous Regions and under different names share objectives and methodological aspects adapted to the Spanish National Health System<sup>14,15</sup>. Since first initiatives took with the sentinel networks in Castilla y León<sup>16,17</sup> and the Basque Country<sup>18</sup>, the rest of Autonomous Regions have developed network for the surveillance of several different diseases, and they have tackled common projects<sup>14</sup>.</font></p>     <p><font face="Verdana" size="2">The Madrid Autonomous Region Sentinel General Practitioner Network came into operation in 1991, and the reporters are volunteer physicians. Although the sampling in 1991 took into account geographic and demographic criteria, the final selection was done by requesting the collaboration from all physicians. Since its creation the network has suffered leavings and substitutions of reporting physicians; these factors, along demographic changes in population, make necessary a reviewing of the design and composition of the network.</font></p>     ]]></body>
<body><![CDATA[<p><font face="Verdana" size="2">The stated aim of this study was to develop a design for probabilistic sampling of reporting physicians in the Madrid Autonomous Region Sentinel General Practitioner Network (SGPN), to ensure the representativeness of the population covered by the network, in order to generalize the design for similar populations.</font></p>     <p>&nbsp;</p>     <p><font face="Verdana" size="2"><b>Methods</b></font></p>     <p><font face="Verdana" size="2">Data sour Information on general practitioners and paediatricians and their patients, broken down by age and sex, was obtained from the Madrid Health Institute's Health-Card Database for the 2005 period.</font></p>     <p><font face="Verdana" size="2">The designated geographic health care unit of reference was the Basic Health Zone (BHZ). There are 247 Basic Health Zones in the Madrid Autonomous Region, each of which represents the catchment area of a given Health Centre and has a median population size of 21,103 persons (range 2522-72,662).</font></p>     <p><font face="Verdana" size="2">Demographic, socio-cultural and socio-work variables were used to describe each BHZ (<a target="_blank" href="/img/revistas/gs/v23n3/original3_t1.jpg">table 1</a>). Variables were obtained from the data base of the Madrid Statistics Institute for municipal register of 2005<sup>19</sup>. To reduce the number of variables without losing relevant information, a principal components analysis was performed<sup>20-22</sup>, using the Varimax method. When extracting factors, account was taken of their eigenvalues and the values obtained in the matrix of rotated components.</font></p>     <p><font face="Verdana" size="2">Once the factors had been obtained, a cluster analysis was performed to group the 247 BHZs into homogeneous strata. Distance between units (BHZs) was measured in terms of the squared Euclidean distance, and the grouping method chosen was Ward's Method, because it is a hierarchical agglomerative method and it tends to make compact, similar sized clusters. The clustering history and dendrogram were then used to obtain the adequate number of clusters after different options were studied. The available statistical package used didn't offer other tools to determinate the number of clusters, but some other can be used, as pseudo-f, pseudo-t-square or cubic cluster criterion (CCC).</font></p>     <p><font face="Verdana" size="2">To test whether the strata were homogeneous and mutually different, we conducted a discriminant analysis, with the stratum or cluster of membership as the grouping variable, and the 5 factors yielded by the principal components analysis as the independent variables. Using variance analysis and Wilks' Lambda statistic, we evaluated whether the factors employed were different in the strata by means of the equality of means test. To assess the discriminant power of the discriminant functions obtained, we examined the eigenvalues and canonical correlation coefficients of such functions (which, when squared, express the percentage of variability explained by the differences between groups), and performed Wilks' Lambda test for each function. The latter can also be converted into a Chi-squared test, with its associated <i>p</i>-value of statistical significance, to verify the null hypothesis that there are no differences among strata by reference to the factors used. In addition, each BHZ's real stratum of membership was compared against its <i>a priori</i> probability of classification, through crossed validation, thereby enabling us to observe how many BHZs had been erroneously classified.</font></p>     <p><font face="Verdana" size="2">The number of persons needed to estimate the incidence rate of the most infrequent process of those monitored in Madrid in 2004 (varicella, herpes zoster, influenza and asthma) was ascertained by assuming that this disease followed a Poisson distribution and that the expected number of cases was greater than 10. Herpes zoster was the selected disease for this calculation, as it was the most infrequent among the monitored processes. Assuming all these factors, the 95% confidence interval of the needed number of cases could it be ascertained by the next approximation:</font></p>     <blockquote> 	    ]]></body>
<body><![CDATA[<p><font face="Verdana" size="2"> 	<img src="/img/revistas/gs/v23n3/original3_fsi1.gif" width="91" height="15"></font></p> </blockquote>     <p><font face="Verdana" size="2">The accuracy of this estimation is the relative accuracy (<i>p</i>) that we want to estimate the rates, and multiplied by the needed number of cases:</font></p>     <blockquote> 	    <p><font face="Verdana" size="2"> 	<img src="/img/revistas/gs/v23n3/original3_fsi2.gif" width="105" height="15"></font></p> </blockquote>     <p><font face="Verdana" size="2">So, the needed number of cases to estimate a rate with a determined accuracy will be:</font></p>     <blockquote> 	    <p><font face="Verdana" size="2"> 	<img src="/img/revistas/gs/v23n3/original3_fsi3.gif" width="63" height="35"></font></p> </blockquote>     <p><font face="Verdana" size="2">We calculated the number of cases needed to estimate a rate with an accuracy of 10%, and an </font> <font face="Symbol" size="2"> <i>a</i></font><font face="Verdana" size="2"> of 0.05, taking into account a design effect of 1.5<sup>23</sup>. Once the necessary number of cases had been established, we then obtained the population required for monitoring purposes based on the herpes zoster incidence rate in Madrid in the preceding year. The resulting population was allocated to the strata in proportion to their respective populations.</font></p>     <p><font face="Verdana" size="2">In the Spanish National Health System, Primary Health Care is given by general practitioners or paediatricians, depending on the age of patients, so it is necessary that sentinel network includes both of them. As the SGPN is made up of Primary Care general practitioners and paediatricians, the population required for monitoring purposes was divided into adult and childhood populations, according to the proportion of population aged under 15 years drawn from the 2005 Madrid Regional population register.</font></p>     <p><font face="Verdana" size="2">In each stratum, general practitioners and paediatricians were consecutively selected by simple random sampling, until the pre-established required minimum populations were reached.</font></p>     ]]></body>
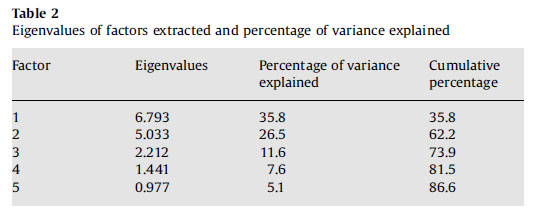
<body><![CDATA[<p><font face="Verdana" size="2">The representativeness of the population monitored by the selected physicians was studied, by age group and sex, with respect to the population of the Madrid Autonomous Region, in line with the 2005 population register. To this end, the proportion of the population in each sex and age group over the total sample selected was compared to the same proportion in the Madrid Autonomous Region.</font></p>     <p><font face="Verdana" size="2">The software used was the statistical package SPSS<sup>®</sup> 13.0.</font></p>     <p>&nbsp;</p>     <p><font face="Verdana" size="2"><b>Results</b></font></p>     <p><font face="Verdana" size="2"><i>Factorial analysis</i></font></p>     <p><font face="Verdana" size="2">Five factors were extracted using the principal-components-analysis method. The first 4 had eigenvalues of over 1 and accounted for 81.5% of the variance. The fifth factor had an eigenvalue very close to 1. As these 5 factors would together account for 86.6% of the variance, we decided to include the fifth factor (<a href="#t2">table 2</a>).</font></p>     <p align=center><font face="Verdana" size="2"><a name="t2"><img src="/img/revistas/gs/v23n3/original3_t2.jpg" width="540" height="219"></a></font></p>     <p>&nbsp;</p>     <p><font face="Verdana" size="2">The contribution of the variables to the 5 factors can be seen in the matrix of rotated components (<a target="_blank" href="/img/revistas/gs/v23n3/original3_t1.jpg">table 1</a>).</font></p>     <p><font face="Verdana" size="2">Factor 1 (eigenvalue: 6.793) was related to demographic variables, registering high values in the most elderly populations, characterised by a high percentage of pensioners and a low percentage of gainfully employed subjects.</font></p>     ]]></body>
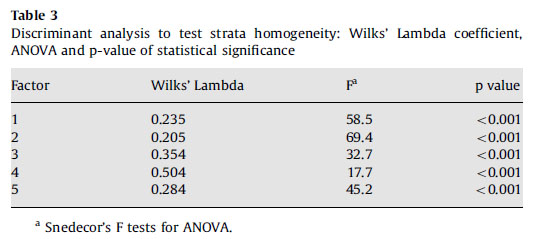
<body><![CDATA[<p><font face="Verdana" size="2">Factor 2 (eigenvalue: 5.033) was mainly related to educational variables, assuming high values in the indicators of intermediate and higher education, and low values in the percentages of: persons with primary education and without any formal education; unemployed persons; and housewives.</font></p>     <p><font face="Verdana" size="2">Factor 3 (eigenvalue: 2.212) was related to variables of immigration, assuming high values in the populations with most immigrants.</font></p>     <p><font face="Verdana" size="2">The main contribution to Factor 4 (eigenvalue: 1.441) was made by the replacement and progressiveness indices, with high values in the youngest populations.</font></p>     <p><font face="Verdana" size="2">Factor 5 (eigenvalue: 0.977) was related to the proportion of subjects under the age of 15 years.</font></p>     <p><font face="Verdana" size="2"><i>Cluster analysis</i></font></p>     <p><font face="Verdana" size="2">On completion of the cluster analysis, 14 strata were obtained. The number of BHZs in these strata ranged from 4 to 34, with a median of 18.</font></p>     <p><font face="Verdana" size="2"><i>Discriminant analysis</i></font></p>     <p><font face="Verdana" size="2">Following the discriminant analysis, the Wilks' Lambda coefficient displayed low values in the equality of means test, reflecting differences among the strata for each factor. Moreover, the F statistics for each of the resulting factors in the analysis of variance (ANOVA) registered associated p-values that were statistically significant (<a href="#t3">table 3</a>).</font></p>     <p align=center><font face="Verdana" size="2"><a name="t3"><img src="/img/revistas/gs/v23n3/original3_t3.jpg" width="535" height="239"></a></font></p>     <p><font face="Verdana" size="2">A total of 5 discriminant functions were obtained: their eigenvalues ranged from 0.90 to 4.06, and their canonical correlation coefficients registered high values, with the lowest being 0.69 and the highest 0.90. As a result, Wilks' Lambda test yielded values very close to 0 for all of the first 4 discriminant functions (<a target="_blank" href="/img/revistas/gs/v23n3/original3_t4.jpg">table 4</a>). Reference to the classification matrix showed that, according to the discriminant functions, 86.6% of the health zones were correctly classified.</font></p>     ]]></body>
<body><![CDATA[<p>&nbsp;</p>     <p><font face="Verdana" size="2"><b>Sample selection</b></font></p>     <p><font face="Verdana" size="2">The number of cases required to estimate an incidence rate with a relative accuracy of 10% was 384. As the herpes zoster incidence rate in Madrid in 2004 was 0.00335932 year<sup>-1</sup>, a population of 114,309 was thus needed. Applying a design effect of 1.5, the necessary population was 171,464 persons, representing 3% of the Madrid Autonomous Region's population. In view of the fact that 14.3% of the Madrid population in 2003 was under the age of 15 years, the required minimum population was 146,946 adults and 24,518 children. These populations were distributed among the 14 strata in proportion to the total populations of each stratum (<a target="_blank" href="/img/revistas/gs/v23n3/original3_t5.jpg">table 5</a>).</font></p>     <p><font face="Verdana" size="2">In each stratum, general practitioners and paediatricians were consecutively selected by simple random sampling, until the pre-established required minimum populations were reached. We consecutively selected 88 general practitioners and 32 paediatricians, until the pre-established required minimum populations were reached; finally general practitioners and paediatricians selected covered populations of 154,610 and 31,336 subjects, respectively.</font></p>     <p><font face="Verdana" size="2">In the representativeness study, no statistically significant differences (<i>p</i>&gt;0.05) were observed between the sample and the Madrid Autonomous Region in terms of the proportions of the population in each age group and sex, except for the groups aged 0 to 4 and 5 to 9 years in both sexes (<a href="#f1">figure 1</a>).</font></p>     <p align=center><font face="Verdana" size="2"><a name="f1"><img src="/img/revistas/gs/v23n3/original3_f1.jpg" width="600" height="282"></a>    <br><b>Fig. 1.</b> Comparison between proportions of population monitored by the selected physicians and the population    <br>of Madrid. Percentages of populations of each age group and both sexes are represented; Madrid populations are    <br>represented by bars and SGPN populations by lines. When a circular marks appears it means that the difference    <br>between both proportions is statistically significant.</font></p>     ]]></body>
<body><![CDATA[<p>&nbsp;</p>     <p><font face="Verdana" size="2"><b>Discussion</b></font></p>     <p><font face="Verdana" size="2">One of the main difficulties of sentinel networks lies in selecting the reporting physicians in such a way that the monitored population is representative of the general population. Most sentinel networks use design or quality control tools to enhance such representativeness as far as possible<sup>3,15</sup>.</font></p>     <p><font face="Verdana" size="2">Indeed, these types of designs, which at times encounter difficulties posed by the great extent of territory to be covered or the dispersion of the population to be monitored, are not always a simple task<sup>24,25</sup>. The reporting physicians in many highly important, traditional networks are volunteers<sup>26-28</sup>.</font></p>     <p><font face="Verdana" size="2">The Madrid Autonomous Region has a considerable population that is not homogeneous, with a great degree of demographic, cultural and economic diversity. Simple random sampling is an effective technique but does not ensure representativeness. However, by dividing the population into strata by means of variables which inform on characteristics that differ between some population groups and others, and selecting subsamples in each stratum, the representation of all in the total sample is guaranteed<sup>15</sup>. Furthermore, if the strata can be made uniform, the accuracy of the estimates obtained will be greater<sup>17,23</sup>. The choice of a probabilistic method is always desiderable, but sometimes the method of selection is limited by the available resources, the health system structure, and the Primary Health Care Services features. In the method presented in this article, physicians are the selected units, since it is not feasible to select a random sample of people attended in Primary Health Care Services; the probabilistic method is not applied to persons but physicians; so every citizen have their own likelihoods to be selected depending on their assigned physicians.</font></p>     <p><font face="Verdana" size="2">In the Madrid Autonomous Region, Basic Health Zones are units of sufficiently small size to ensure that the demographic, socio-economic and socio-cultural variables within them are homogeneous. Hence, a technique such as cluster analysis can efficiently yield strata composed of various BHZs having similar characteristics. Random selection of reporting physicians in each stratum renders this design capable of producing a sample that is representative and estimators that are unbiased and accurate.</font></p>     <p><font face="Verdana" size="2">A number of physicians was selected in each stratum in such a way as to guarantee that the monitored population exceeded the pre-established minimum required.</font></p>     <p><font face="Verdana" size="2">The study's representativeness highlighted the fact that the population covered by the selected sample of physicians was representative of the population of the Madrid Autonomous Region in terms of age and sex, though in the 0-4 and 5-9 age groups, the proportion of the monitored population was significantly higher than the proportion of the population of the Madrid Autonomous Region. This was due to the fact that in the smallest strata, the minimum paediatric population required was likewise very small, and that the population monitored in these strata by the first paediatrician selected was far higher. Nevertheless, the magnitudes of the differences observed were small, and there is no reason why this should in any way compromise the validity of the results obtained by the network. The good representativeness of the selected sample according to the general population of Madrid is a positive point in the sample selection process.</font></p>     <p><font face="Verdana" size="2">The data of population assigned to each physician come from Madrid Health Institute's Health-Card Database, which includes all population; however there are a percentage of people that use private health services. It is important to take into account that this fact could to influence the sampling design by underestimating the incidence rates of the monitored diseases. This bias can be partially reduced if we monitor a larger population than theoretically defined.</font></p>     <p><font face="Verdana" size="2">One of the limitations of this design might be the fact that geographic criteria were not taken into account. The Madrid Autonomous Region is a small territory, with little geographic spread, so that any possible social, economic or cultural differences are geographically close. That is the reason of include social and demographic variables, but in case of a selection of a sample in territories with different features is necessary to consider other data as population density or geographic dispersion. Accordingly, we chose to take cluster analysis into account as a technique for obtaining homogeneous units, even though the ensuing strata may not be territories that are geographically united. The choice of a mainly adult disease as herpes zoster to pre-determinate the sample size does not affect the validity neither of the design nor the obtained results, as childhood diseases currently monitored are more frequent. Although a specific process as herpes zoster has supported it, we must emphasize that the aim of this work is to set the frame of a design applicable to future studies.</font></p>     ]]></body>
<body><![CDATA[<p><font face="Verdana" size="2">Although a design effect of 1.5 was applied, when a multistage method is designed, a higher design effect should be used if the design is very complex.</font></p>     <p><font face="Verdana" size="2">Another limitation of the study could be the fact of a high percentage of selected physicians refused to collaborate, as a voluntariness bias could be introduced and the representativeness of sample would be affected. Nevertheless, if a physician refused to participate, another one would be selected by simple random sampling in the same stratus. It is not foreseeable a high number of rejections, as Primary Health Care physicians keep a strong commitment with their labour, and the burden derived from the work in the sentinel network is not expected to be excessive.</font></p>     <p><font face="Verdana" size="2">In view of the fact that sentinel networks are being increasingly used in epidemiological surveillance, suitable designs are required to ensure attainment of their designated goals.</font></p>     <p><font face="Verdana" size="2">In order to be able to generalise the results obtained, a feature to be sought is the representativeness of the network vis-à-vis the general population. Cluster analysis is a method that answers this need. To this end, it is necessary to have sampling units that are as unaggregated as possible, together with information on demographic, social, economic or cultural factors of interest.</font></p>     <p><font face="Verdana" size="2">Furthermore, selection of physicians by probabilistic methods, as in this study, affords the chance of ascertaining the degree of accuracy of the estimates obtained, thereby adding value to the data collected by sentinel networks.</font></p>     <p>&nbsp;</p>     <p><font face="Verdana" size="2"><b>Acknowledgements</b></font></p>     <p><font face="Verdana" size="2">The authors thank Drs. Roberto Pastor-Barriuso and Javier Damián for their helpful comments on the design of the paper.</font></p>     <p>&nbsp;</p>     <p><font face="Verdana" size="2"><b>Bibliografía</b></font></p>     ]]></body>
<body><![CDATA[<!-- ref --><p><font face="Verdana" size="2">1. Bartelds A.I.M. Continuous morbidity registration sentinel at Dutch sentinel stations, 2003. Utrecht: NIVEL; 2004.</font>&nbsp;&nbsp;&nbsp;&nbsp;&nbsp;&nbsp;&nbsp;&nbsp;[&#160;<a href="javascript:void(0);" onclick="javascript: window.open('/scielo.php?script=sci_nlinks&ref=2410841&pid=S0213-9111200900030000400001&lng=','','width=640,height=500,resizable=yes,scrollbars=1,menubar=yes,');">Links</a>&#160;]<!-- end-ref --><!-- ref --><p><font face="Verdana" size="2">2. Thomas P, Griffiths F., Kai J, et al. Networks for research in primary health care. BMJ. 2001; 322:588-90.</font>&nbsp;&nbsp;&nbsp;&nbsp;&nbsp;&nbsp;&nbsp;&nbsp;[&#160;<a href="javascript:void(0);" onclick="javascript: window.open('/scielo.php?script=sci_nlinks&ref=2410842&pid=S0213-9111200900030000400002&lng=','','width=640,height=500,resizable=yes,scrollbars=1,menubar=yes,');">Links</a>&#160;]<!-- end-ref --><!-- ref --><p><font face="Verdana" size="2">3. Deckers J.G, Paget W.J, Schellevis F.G, et al. European primary care surveillance networks: their structure and operation. Fam Pract. 2006; 23:151-8.</font>&nbsp;&nbsp;&nbsp;&nbsp;&nbsp;&nbsp;&nbsp;&nbsp;[&#160;<a href="javascript:void(0);" onclick="javascript: window.open('/scielo.php?script=sci_nlinks&ref=2410843&pid=S0213-9111200900030000400003&lng=','','width=640,height=500,resizable=yes,scrollbars=1,menubar=yes,');">Links</a>&#160;]<!-- end-ref --><!-- ref --><p><font face="Verdana" size="2">4. Ciofi Degli Atti M.L, Salmaso S, Bella A, et al. Pediatric sentinel surveillance of vaccine-preventable diseases in Italy. Pediatr Infect Dis J. 2002; 21:763-8.</font>&nbsp;&nbsp;&nbsp;&nbsp;&nbsp;&nbsp;&nbsp;&nbsp;[&#160;<a href="javascript:void(0);" onclick="javascript: window.open('/scielo.php?script=sci_nlinks&ref=2410844&pid=S0213-9111200900030000400004&lng=','','width=640,height=500,resizable=yes,scrollbars=1,menubar=yes,');">Links</a>&#160;]<!-- end-ref --><!-- ref --><p><font face="Verdana" size="2">5. Dedman D.J, Zambon M, Buynder P.V, et al. Influenza surveillance in England and Wales: October 1997 to June 1998. Commun Dis Public Health. 1998; 1:244-51.</font>&nbsp;&nbsp;&nbsp;&nbsp;&nbsp;&nbsp;&nbsp;&nbsp;[&#160;<a href="javascript:void(0);" onclick="javascript: window.open('/scielo.php?script=sci_nlinks&ref=2410845&pid=S0213-9111200900030000400005&lng=','','width=640,height=500,resizable=yes,scrollbars=1,menubar=yes,');">Links</a>&#160;]<!-- end-ref --><!-- ref --><p><font face="Verdana" size="2">6. Massari V, Maison P, Desenclos J.C, et al. Six years of sentinel surveillance of hepatitis B in general practice in France. Eur J Epidemiol. 1998; 14:765-7.</font>&nbsp;&nbsp;&nbsp;&nbsp;&nbsp;&nbsp;&nbsp;&nbsp;[&#160;<a href="javascript:void(0);" onclick="javascript: window.open('/scielo.php?script=sci_nlinks&ref=2410846&pid=S0213-9111200900030000400006&lng=','','width=640,height=500,resizable=yes,scrollbars=1,menubar=yes,');">Links</a>&#160;]<!-- end-ref --><!-- ref --><p><font face="Verdana" size="2">7. Ordobas M.A, Zorrilla B, Arias P. Influenza in Madrid, Spain, 1991-92: validity of the sentinel network. J Epidemiol Community Health. 1995; 49(Suppl 1):14-6.</font>&nbsp;&nbsp;&nbsp;&nbsp;&nbsp;&nbsp;&nbsp;&nbsp;[&#160;<a href="javascript:void(0);" onclick="javascript: window.open('/scielo.php?script=sci_nlinks&ref=2410847&pid=S0213-9111200900030000400007&lng=','','width=640,height=500,resizable=yes,scrollbars=1,menubar=yes,');">Links</a>&#160;]<!-- end-ref --><!-- ref --><p><font face="Verdana" size="2">8. Arteagoitia J.M, Larranaga M.I, Rodriguez J.L, et al. Incidence, prevalence and coronary heart disease risk level in known type 2 diabetes: a sentinel practice network study in the Basque Country, Spain. Diabetologia. 2003; 46:899-909.</font>&nbsp;&nbsp;&nbsp;&nbsp;&nbsp;&nbsp;&nbsp;&nbsp;[&#160;<a href="javascript:void(0);" onclick="javascript: window.open('/scielo.php?script=sci_nlinks&ref=2410848&pid=S0213-9111200900030000400008&lng=','','width=640,height=500,resizable=yes,scrollbars=1,menubar=yes,');">Links</a>&#160;]<!-- end-ref --><!-- ref --><p><font face="Verdana" size="2">9. Fleming D.M, Schellevis F.G, Van Casteren V. The prevalence of known diabetes in eight European countries. Eur J Public Health. 2004; 14:10-4.</font>&nbsp;&nbsp;&nbsp;&nbsp;&nbsp;&nbsp;&nbsp;&nbsp;[&#160;<a href="javascript:void(0);" onclick="javascript: window.open('/scielo.php?script=sci_nlinks&ref=2410849&pid=S0213-9111200900030000400009&lng=','','width=640,height=500,resizable=yes,scrollbars=1,menubar=yes,');">Links</a>&#160;]<!-- end-ref --><!-- ref --><p><font face="Verdana" size="2">10. Devroey D, Van C.V, De Lepeleire J. Revealing regional differences in the institutionalization of adult patients in homes for the elderly and nursing homes: results of the Belgian network of sentinel GPs. Fam Pract. 2001; 18:39-41.</font>&nbsp;&nbsp;&nbsp;&nbsp;&nbsp;&nbsp;&nbsp;&nbsp;[&#160;<a href="javascript:void(0);" onclick="javascript: window.open('/scielo.php?script=sci_nlinks&ref=2410850&pid=S0213-9111200900030000400010&lng=','','width=640,height=500,resizable=yes,scrollbars=1,menubar=yes,');">Links</a>&#160;]<!-- end-ref --><!-- ref --><p><font face="Verdana" size="2">11. Le Pont F, Letrilliart L, Massari V, et al. Suicide and attempted suicide in Fran results of a general practice sentinel network, 1999-2001. Br J Gen Pract. 2004; 54:282-4.</font>&nbsp;&nbsp;&nbsp;&nbsp;&nbsp;&nbsp;&nbsp;&nbsp;[&#160;<a href="javascript:void(0);" onclick="javascript: window.open('/scielo.php?script=sci_nlinks&ref=2410851&pid=S0213-9111200900030000400011&lng=','','width=640,height=500,resizable=yes,scrollbars=1,menubar=yes,');">Links</a>&#160;]<!-- end-ref --><!-- ref --><p><font face="Verdana" size="2">12. Fornaro P, Gandini F, Marin M, et al. Epidemiology and cost analysis of varicella in Italy: results of a sentinel study in the pediatric practice. Italian Sentinel Group on Pediatric Infectious Diseases. Pediatr Infect Dis J. 1999; 18:414-9.</font>&nbsp;&nbsp;&nbsp;&nbsp;&nbsp;&nbsp;&nbsp;&nbsp;[&#160;<a href="javascript:void(0);" onclick="javascript: window.open('/scielo.php?script=sci_nlinks&ref=2410852&pid=S0213-9111200900030000400012&lng=','','width=640,height=500,resizable=yes,scrollbars=1,menubar=yes,');">Links</a>&#160;]<!-- end-ref --><!-- ref --><p><font face="Verdana" size="2">13. Schlaud M, Brenner M.H, Hoopmann M, et al. Approaches to the denominator in practice-based epidemiology: a critical overview. J Epidemiol Community Health. 1998; 52(Suppl 1):13S-9S.</font>&nbsp;&nbsp;&nbsp;&nbsp;&nbsp;&nbsp;&nbsp;&nbsp;[&#160;<a href="javascript:void(0);" onclick="javascript: window.open('/scielo.php?script=sci_nlinks&ref=2410853&pid=S0213-9111200900030000400013&lng=','','width=640,height=500,resizable=yes,scrollbars=1,menubar=yes,');">Links</a>&#160;]<!-- end-ref --><!-- ref --><p><font face="Verdana" size="2">14. Proyecto RECENT. Redes Centinelas Sanitarias. 2008. Available from: <a target="_blank" href="http://www.redescentinelas.com/">http://www.redescentinelas.com/</a>.</font>&nbsp;&nbsp;&nbsp;&nbsp;&nbsp;&nbsp;&nbsp;&nbsp;[&#160;<a href="javascript:void(0);" onclick="javascript: window.open('/scielo.php?script=sci_nlinks&ref=2410854&pid=S0213-9111200900030000400014&lng=','','width=640,height=500,resizable=yes,scrollbars=1,menubar=yes,');">Links</a>&#160;]<!-- end-ref --><!-- ref --><p><font face="Verdana" size="2">15. Vega Alonso A.T, Zurriaga L.O, Galmes T.A, et al. Guía de principios y métodos de las redes centinelas sanitarias en España. Gac Sanit. 2006; 20(Suppl 3):52-60.</font>&nbsp;&nbsp;&nbsp;&nbsp;&nbsp;&nbsp;&nbsp;&nbsp;[&#160;<a href="javascript:void(0);" onclick="javascript: window.open('/scielo.php?script=sci_nlinks&ref=2410855&pid=S0213-9111200900030000400015&lng=','','width=640,height=500,resizable=yes,scrollbars=1,menubar=yes,');">Links</a>&#160;]<!-- end-ref --><!-- ref --><p><font face="Verdana" size="2">16. Consejería de Sanidad de Castilla y León. Red Centinela Sanitaria de Castilla y León. 2008. Available from: http://www.sanidad.jcyl.es/sanidad/cm/profesionales/tkContent?idContent=420&amp;locale=es_ES&amp;textOnly=false.</font>&nbsp;&nbsp;&nbsp;&nbsp;&nbsp;&nbsp;&nbsp;&nbsp;[&#160;<a href="javascript:void(0);" onclick="javascript: window.open('/scielo.php?script=sci_nlinks&ref=2410856&pid=S0213-9111200900030000400016&lng=','','width=640,height=500,resizable=yes,scrollbars=1,menubar=yes,');">Links</a>&#160;]<!-- end-ref --><!-- ref --><p><font face="Verdana" size="2">17. Vega Alonso A.T., Gil C.M., Ruiz C.C., et al. La Red de Médicos Centinelas de Castilla y León: aplicación del análisis de conglomerados para la obtención de una población representativa. Gac Sanit. 1990; 4:184-8.</font>&nbsp;&nbsp;&nbsp;&nbsp;&nbsp;&nbsp;&nbsp;&nbsp;[&#160;<a href="javascript:void(0);" onclick="javascript: window.open('/scielo.php?script=sci_nlinks&ref=2410857&pid=S0213-9111200900030000400017&lng=','','width=640,height=500,resizable=yes,scrollbars=1,menubar=yes,');">Links</a>&#160;]<!-- end-ref --><!-- ref --><p><font face="Verdana" size="2">18. Médicos vigía: un instrumento para la vigilancia e investigación epidemiológica. Red de médicos vigía del País Vasco 1990-2002. Vitoria-Gasteiz: Departamento de Sanidad, Gobierno Vasco; 2002.</font>&nbsp;&nbsp;&nbsp;&nbsp;&nbsp;&nbsp;&nbsp;&nbsp;[&#160;<a href="javascript:void(0);" onclick="javascript: window.open('/scielo.php?script=sci_nlinks&ref=2410858&pid=S0213-9111200900030000400018&lng=','','width=640,height=500,resizable=yes,scrollbars=1,menubar=yes,');">Links</a>&#160;]<!-- end-ref --><!-- ref --><p><font face="Verdana" size="2">19. Instituto de Estadística de la Comunidad de Madrid. Padrón continuo 2005. Zonificación de Salud. 2008. Available from: <a target="_blank" href="http://www.madrid.org/iestadis/fijas/estructu/demograficas/padron/pc05i5.htm">http://www.madrid.org/iestadis/fijas/estructu/demograficas/padron/pc05i5.htm</a>.</font>&nbsp;&nbsp;&nbsp;&nbsp;&nbsp;&nbsp;&nbsp;&nbsp;[&#160;<a href="javascript:void(0);" onclick="javascript: window.open('/scielo.php?script=sci_nlinks&ref=2410859&pid=S0213-9111200900030000400019&lng=','','width=640,height=500,resizable=yes,scrollbars=1,menubar=yes,');">Links</a>&#160;]<!-- end-ref --><!-- ref --><p><font face="Verdana" size="2">20. Kleinbaum D.G, Kupper L.L., Muller K.E. Applied regression analysis and other multivariable methods. 2nd ed. Belmont, CA: Duxbury Press; 1988.</font>&nbsp;&nbsp;&nbsp;&nbsp;&nbsp;&nbsp;&nbsp;&nbsp;[&#160;<a href="javascript:void(0);" onclick="javascript: window.open('/scielo.php?script=sci_nlinks&ref=2410860&pid=S0213-9111200900030000400020&lng=','','width=640,height=500,resizable=yes,scrollbars=1,menubar=yes,');">Links</a>&#160;]<!-- end-ref --><!-- ref --><p><font face="Verdana" size="2">21. Raykov T., Marcoulides G.A. An Introduction to Applied Multivariate Analysis. New York: Taylor &amp; Francis; 2008.</font>&nbsp;&nbsp;&nbsp;&nbsp;&nbsp;&nbsp;&nbsp;&nbsp;[&#160;<a href="javascript:void(0);" onclick="javascript: window.open('/scielo.php?script=sci_nlinks&ref=2410861&pid=S0213-9111200900030000400021&lng=','','width=640,height=500,resizable=yes,scrollbars=1,menubar=yes,');">Links</a>&#160;]<!-- end-ref --><!-- ref --><p><font face="Verdana" size="2">22. Anderson T.W. An introduction to Multivariate Statistical Analysis. 2nd ed. New York: Wiley; 1984.</font>&nbsp;&nbsp;&nbsp;&nbsp;&nbsp;&nbsp;&nbsp;&nbsp;[&#160;<a href="javascript:void(0);" onclick="javascript: window.open('/scielo.php?script=sci_nlinks&ref=2410862&pid=S0213-9111200900030000400022&lng=','','width=640,height=500,resizable=yes,scrollbars=1,menubar=yes,');">Links</a>&#160;]<!-- end-ref --><!-- ref --><p><font face="Verdana" size="2">23. Silva Ayçaguer L.C. Diseño razonado de muestras y captación de datos para la investigación sanitaria. Madrid: Díaz de Santos; 2000.</font>&nbsp;&nbsp;&nbsp;&nbsp;&nbsp;&nbsp;&nbsp;&nbsp;[&#160;<a href="javascript:void(0);" onclick="javascript: window.open('/scielo.php?script=sci_nlinks&ref=2410863&pid=S0213-9111200900030000400023&lng=','','width=640,height=500,resizable=yes,scrollbars=1,menubar=yes,');">Links</a>&#160;]<!-- end-ref --><!-- ref --><p><font face="Verdana" size="2">24. Wilson I. Australian Sentinel Practice Research Network. Commun Dis Intell. 2003; 27:123-4.</font>&nbsp;&nbsp;&nbsp;&nbsp;&nbsp;&nbsp;&nbsp;&nbsp;[&#160;<a href="javascript:void(0);" onclick="javascript: window.open('/scielo.php?script=sci_nlinks&ref=2410864&pid=S0213-9111200900030000400024&lng=','','width=640,height=500,resizable=yes,scrollbars=1,menubar=yes,');">Links</a>&#160;]<!-- end-ref --><!-- ref --><p><font face="Verdana" size="2">25. Tilyard M, Dovey S. The role of sentinel networks in general practice research in New Zealand and internationally. NZFP. 1999; 26.</font>&nbsp;&nbsp;&nbsp;&nbsp;&nbsp;&nbsp;&nbsp;&nbsp;[&#160;<a href="javascript:void(0);" onclick="javascript: window.open('/scielo.php?script=sci_nlinks&ref=2410865&pid=S0213-9111200900030000400025&lng=','','width=640,height=500,resizable=yes,scrollbars=1,menubar=yes,');">Links</a>&#160;]<!-- end-ref --><!-- ref --><p><font face="Verdana" size="2">26. Van Casteren V. Belgian Sentinel general practitioners. Belgium Scientific Institute of Public health. 2006. Available from: <a target="_blank" href="http://www.iph.fgov.be/epidemio/epien/PROG10.HTM">http://www.iph.fgov.be/epidemio/epien/PROG10.HTM</a>.</font>&nbsp;&nbsp;&nbsp;&nbsp;&nbsp;&nbsp;&nbsp;&nbsp;[&#160;<a href="javascript:void(0);" onclick="javascript: window.open('/scielo.php?script=sci_nlinks&ref=2410866&pid=S0213-9111200900030000400026&lng=','','width=640,height=500,resizable=yes,scrollbars=1,menubar=yes,');">Links</a>&#160;]<!-- end-ref --><!-- ref --><p><font face="Verdana" size="2">27. Green L.A, Miller R.S, Reed F.M, et al. How representative of typical practice are practice-based research networks? A report from the Ambulatory Sentinel Practice Network Inc (ASPN). Arch Fam Med. 1993; 2:939-49.</font>&nbsp;&nbsp;&nbsp;&nbsp;&nbsp;&nbsp;&nbsp;&nbsp;[&#160;<a href="javascript:void(0);" onclick="javascript: window.open('/scielo.php?script=sci_nlinks&ref=2410867&pid=S0213-9111200900030000400027&lng=','','width=640,height=500,resizable=yes,scrollbars=1,menubar=yes,');">Links</a>&#160;]<!-- end-ref --><!-- ref --><p><font face="Verdana" size="2">28. Lobet M.P, Stroobant A, Mertens R, et al. Tool for validation of the network of sentinel general practitioners in the Belgian health care system. Int J Epidemiol. 1987; 16:612-8.</font>&nbsp;&nbsp;&nbsp;&nbsp;&nbsp;&nbsp;&nbsp;&nbsp;[&#160;<a href="javascript:void(0);" onclick="javascript: window.open('/scielo.php?script=sci_nlinks&ref=2410868&pid=S0213-9111200900030000400028&lng=','','width=640,height=500,resizable=yes,scrollbars=1,menubar=yes,');">Links</a>&#160;]<!-- end-ref --><p>&nbsp;</p>     <p>&nbsp;</p>     ]]></body>
<body><![CDATA[<p><font face="Verdana" size="2"><b><a href="#top"><img border="0" src="/img/revistas/gs/v23n3/seta.gif" width="15" height="17"></a><a name="bajo"></a>Correspondence:</b>    <br><a href="mailto:napo@napo.jazztel.es">napo@napo.jazztel.es</a>    <br>(N. Pérez-Farinós)</font></p>     <p><font face="Verdana" size="2">Received 17 February 2008    <br>Accepted 14 May 2008</font></p>      ]]></body><back>
<ref-list>
<ref id="B1">
<label>1</label><nlm-citation citation-type="book">
<person-group person-group-type="author">
<name>
<surname><![CDATA[Bartelds]]></surname>
<given-names><![CDATA[A]]></given-names>
</name>
</person-group>
<source><![CDATA[I. M. Continuous morbidity registration sentinel at Dutch sentinel stations, 2003]]></source>
<year>2004</year>
<publisher-loc><![CDATA[Utrecht ]]></publisher-loc>
<publisher-name><![CDATA[NIVEL]]></publisher-name>
</nlm-citation>
</ref>
<ref id="B2">
<label>2</label><nlm-citation citation-type="journal">
<person-group person-group-type="author">
<name>
<surname><![CDATA[Thomas]]></surname>
<given-names><![CDATA[P]]></given-names>
</name>
<name>
<surname><![CDATA[Griffiths]]></surname>
<given-names><![CDATA[F.]]></given-names>
</name>
<name>
<surname><![CDATA[Kai]]></surname>
<given-names><![CDATA[J]]></given-names>
</name>
</person-group>
<article-title xml:lang="en"><![CDATA[Networks for research in primary health care]]></article-title>
<source><![CDATA[BMJ]]></source>
<year>2001</year>
<volume>322</volume>
<page-range>588-90</page-range></nlm-citation>
</ref>
<ref id="B3">
<label>3</label><nlm-citation citation-type="journal">
<person-group person-group-type="author">
<name>
<surname><![CDATA[Deckers]]></surname>
<given-names><![CDATA[J.G]]></given-names>
</name>
<name>
<surname><![CDATA[Paget]]></surname>
<given-names><![CDATA[W.J]]></given-names>
</name>
<name>
<surname><![CDATA[Schellevis]]></surname>
<given-names><![CDATA[F.G]]></given-names>
</name>
</person-group>
<article-title xml:lang="en"><![CDATA[European primary care surveillance networks: their structure and operation]]></article-title>
<source><![CDATA[Fam Pract]]></source>
<year>2006</year>
<volume>23</volume>
<page-range>151-8</page-range></nlm-citation>
</ref>
<ref id="B4">
<label>4</label><nlm-citation citation-type="journal">
<person-group person-group-type="author">
<name>
<surname><![CDATA[Ciofi Degli Atti]]></surname>
<given-names><![CDATA[M.L]]></given-names>
</name>
<name>
<surname><![CDATA[Salmaso]]></surname>
<given-names><![CDATA[S]]></given-names>
</name>
<name>
<surname><![CDATA[Bella]]></surname>
<given-names><![CDATA[A]]></given-names>
</name>
</person-group>
<article-title xml:lang="en"><![CDATA[Pediatric sentinel surveillance of vaccine-preventable diseases in Italy]]></article-title>
<source><![CDATA[Pediatr Infect Dis J]]></source>
<year>2002</year>
<volume>21</volume>
<page-range>763-8</page-range></nlm-citation>
</ref>
<ref id="B5">
<label>5</label><nlm-citation citation-type="journal">
<person-group person-group-type="author">
<name>
<surname><![CDATA[Dedman]]></surname>
<given-names><![CDATA[D.J]]></given-names>
</name>
<name>
<surname><![CDATA[Zambon]]></surname>
<given-names><![CDATA[M]]></given-names>
</name>
<name>
<surname><![CDATA[Buynder]]></surname>
<given-names><![CDATA[P.V]]></given-names>
</name>
</person-group>
<article-title xml:lang="en"><![CDATA[Influenza surveillance in England and Wales: October 1997 to June 1998]]></article-title>
<source><![CDATA[Commun Dis Public Health]]></source>
<year>1998</year>
<volume>1</volume>
<page-range>244-51</page-range></nlm-citation>
</ref>
<ref id="B6">
<label>6</label><nlm-citation citation-type="journal">
<person-group person-group-type="author">
<name>
<surname><![CDATA[Massari]]></surname>
<given-names><![CDATA[V]]></given-names>
</name>
<name>
<surname><![CDATA[Maison]]></surname>
<given-names><![CDATA[P]]></given-names>
</name>
<name>
<surname><![CDATA[Desenclos]]></surname>
<given-names><![CDATA[J.C]]></given-names>
</name>
</person-group>
<article-title xml:lang="en"><![CDATA[Six years of sentinel surveillance of hepatitis B in general practice in France]]></article-title>
<source><![CDATA[Eur J Epidemiol]]></source>
<year>1998</year>
<volume>14</volume>
<page-range>765-7</page-range></nlm-citation>
</ref>
<ref id="B7">
<label>7</label><nlm-citation citation-type="journal">
<person-group person-group-type="author">
<name>
<surname><![CDATA[Ordobas]]></surname>
<given-names><![CDATA[M.A]]></given-names>
</name>
<name>
<surname><![CDATA[Zorrilla]]></surname>
<given-names><![CDATA[B]]></given-names>
</name>
<name>
<surname><![CDATA[Arias]]></surname>
<given-names><![CDATA[P]]></given-names>
</name>
</person-group>
<article-title xml:lang="en"><![CDATA[Influenza in Madrid, Spain, 1991-92: validity of the sentinel network]]></article-title>
<source><![CDATA[J Epidemiol Community Health]]></source>
<year>1995</year>
<volume>49</volume>
<numero>^s1</numero>
<issue>^s1</issue>
<supplement>1</supplement>
<page-range>14-6</page-range></nlm-citation>
</ref>
<ref id="B8">
<label>8</label><nlm-citation citation-type="journal">
<person-group person-group-type="author">
<name>
<surname><![CDATA[Arteagoitia]]></surname>
<given-names><![CDATA[J.M]]></given-names>
</name>
<name>
<surname><![CDATA[Larranaga]]></surname>
<given-names><![CDATA[M.I]]></given-names>
</name>
<name>
<surname><![CDATA[Rodriguez]]></surname>
<given-names><![CDATA[J.L]]></given-names>
</name>
</person-group>
<article-title xml:lang="en"><![CDATA[Incidence, prevalence and coronary heart disease risk level in known type 2 diabetes: a sentinel practice network study in the Basque Country, Spain]]></article-title>
<source><![CDATA[Diabetologia]]></source>
<year>2003</year>
<volume>46</volume>
<page-range>899-909</page-range></nlm-citation>
</ref>
<ref id="B9">
<label>9</label><nlm-citation citation-type="journal">
<person-group person-group-type="author">
<name>
<surname><![CDATA[Fleming]]></surname>
<given-names><![CDATA[D.M]]></given-names>
</name>
<name>
<surname><![CDATA[Schellevis]]></surname>
<given-names><![CDATA[F.G]]></given-names>
</name>
<name>
<surname><![CDATA[Van Casteren]]></surname>
<given-names><![CDATA[V]]></given-names>
</name>
</person-group>
<article-title xml:lang="en"><![CDATA[The prevalence of known diabetes in eight European countries]]></article-title>
<source><![CDATA[Eur J Public Health]]></source>
<year>2004</year>
<volume>14</volume>
<page-range>10-4</page-range></nlm-citation>
</ref>
<ref id="B10">
<label>10</label><nlm-citation citation-type="journal">
<person-group person-group-type="author">
<name>
<surname><![CDATA[Devroey]]></surname>
<given-names><![CDATA[D]]></given-names>
</name>
<name>
<surname><![CDATA[Van]]></surname>
<given-names><![CDATA[C.V]]></given-names>
</name>
<name>
<surname><![CDATA[De Lepeleire]]></surname>
<given-names><![CDATA[J]]></given-names>
</name>
</person-group>
<article-title xml:lang="en"><![CDATA[Revealing regional differences in the institutionalization of adult patients in homes for the elderly and nursing homes: results of the Belgian network of sentinel GPs]]></article-title>
<source><![CDATA[Fam Pract]]></source>
<year>2001</year>
<volume>18</volume>
<page-range>39-41</page-range></nlm-citation>
</ref>
<ref id="B11">
<label>11</label><nlm-citation citation-type="journal">
<person-group person-group-type="author">
<name>
<surname><![CDATA[Le Pont]]></surname>
<given-names><![CDATA[F]]></given-names>
</name>
<name>
<surname><![CDATA[Letrilliart]]></surname>
<given-names><![CDATA[L]]></given-names>
</name>
<name>
<surname><![CDATA[Massari]]></surname>
<given-names><![CDATA[V]]></given-names>
</name>
</person-group>
<article-title xml:lang="en"><![CDATA[Suicide and attempted suicide in Fran results of a general practice sentinel network, 1999-2001]]></article-title>
<source><![CDATA[Br J Gen Pract]]></source>
<year>2004</year>
<volume>54</volume>
<page-range>282-4</page-range></nlm-citation>
</ref>
<ref id="B12">
<label>12</label><nlm-citation citation-type="journal">
<person-group person-group-type="author">
<name>
<surname><![CDATA[Fornaro]]></surname>
<given-names><![CDATA[P]]></given-names>
</name>
<name>
<surname><![CDATA[Gandini]]></surname>
<given-names><![CDATA[F]]></given-names>
</name>
<name>
<surname><![CDATA[Marin]]></surname>
<given-names><![CDATA[M]]></given-names>
</name>
</person-group>
<article-title xml:lang="en"><![CDATA[Epidemiology and cost analysis of varicella in Italy: results of a sentinel study in the pediatric practice. Italian Sentinel Group on Pediatric Infectious Diseases]]></article-title>
<source><![CDATA[Pediatr Infect Dis J]]></source>
<year>1999</year>
<volume>18</volume>
<page-range>414-9</page-range></nlm-citation>
</ref>
<ref id="B13">
<label>13</label><nlm-citation citation-type="journal">
<person-group person-group-type="author">
<name>
<surname><![CDATA[Schlaud]]></surname>
<given-names><![CDATA[M]]></given-names>
</name>
<name>
<surname><![CDATA[Brenner]]></surname>
<given-names><![CDATA[M.H]]></given-names>
</name>
<name>
<surname><![CDATA[Hoopmann]]></surname>
<given-names><![CDATA[M]]></given-names>
</name>
</person-group>
<article-title xml:lang="en"><![CDATA[Approaches to the denominator in practice-based epidemiology: a critical overview]]></article-title>
<source><![CDATA[J Epidemiol Community Health]]></source>
<year>1998</year>
<volume>52</volume>
<numero>^s1</numero>
<issue>^s1</issue>
<supplement>1</supplement>
<page-range>13S-9S</page-range></nlm-citation>
</ref>
<ref id="B14">
<label>14</label><nlm-citation citation-type="">
<source><![CDATA[Proyecto RECENT: Redes Centinelas Sanitarias]]></source>
<year>2008</year>
</nlm-citation>
</ref>
<ref id="B15">
<label>15</label><nlm-citation citation-type="journal">
<person-group person-group-type="author">
<name>
<surname><![CDATA[Vega Alonso]]></surname>
<given-names><![CDATA[A.T]]></given-names>
</name>
<name>
<surname><![CDATA[Zurriaga]]></surname>
<given-names><![CDATA[L.O]]></given-names>
</name>
<name>
<surname><![CDATA[Galmes]]></surname>
<given-names><![CDATA[T.A]]></given-names>
</name>
</person-group>
<article-title xml:lang="es"><![CDATA[Guía de principios y métodos de las redes centinelas sanitarias en España]]></article-title>
<source><![CDATA[Gac Sanit]]></source>
<year>2006</year>
<volume>20</volume>
<numero>^s3</numero>
<issue>^s3</issue>
<supplement>3</supplement>
<page-range>52-60</page-range></nlm-citation>
</ref>
<ref id="B16">
<label>16</label><nlm-citation citation-type="">
<collab>Castilla y León^dConsejería de Sanidad</collab>
<source><![CDATA[Red Centinela Sanitaria de Castilla y León]]></source>
<year>2008</year>
</nlm-citation>
</ref>
<ref id="B17">
<label>17</label><nlm-citation citation-type="journal">
<person-group person-group-type="author">
<name>
<surname><![CDATA[Vega Alonso]]></surname>
<given-names><![CDATA[A.T.]]></given-names>
</name>
<name>
<surname><![CDATA[Gil]]></surname>
<given-names><![CDATA[C.M.]]></given-names>
</name>
<name>
<surname><![CDATA[Ruiz]]></surname>
<given-names><![CDATA[C.C.]]></given-names>
</name>
</person-group>
<article-title xml:lang="es"><![CDATA[La Red de Médicos Centinelas de Castilla y León: aplicación del análisis de conglomerados para la obtención de una población representativa]]></article-title>
<source><![CDATA[Gac Sanit]]></source>
<year>1990</year>
<volume>4</volume>
<page-range>184-8</page-range></nlm-citation>
</ref>
<ref id="B18">
<label>18</label><nlm-citation citation-type="book">
<source><![CDATA[Médicos vigía: un instrumento para la vigilancia e investigación epidemiológica: Red de médicos vigía del País Vasco 1990-2002]]></source>
<year>2002</year>
<publisher-loc><![CDATA[Vitoria-Gasteiz ]]></publisher-loc>
<publisher-name><![CDATA[Departamento de Sanidad, Gobierno Vasco]]></publisher-name>
</nlm-citation>
</ref>
<ref id="B19">
<label>19</label><nlm-citation citation-type="">
<collab>Comunidad de Madrid^dInstituto de Estadística</collab>
<source><![CDATA[Padrón continuo 2005: Zonificación de Salud]]></source>
<year>2008</year>
</nlm-citation>
</ref>
<ref id="B20">
<label>20</label><nlm-citation citation-type="book">
<person-group person-group-type="author">
<name>
<surname><![CDATA[Kleinbaum]]></surname>
<given-names><![CDATA[D.G]]></given-names>
</name>
<name>
<surname><![CDATA[Kupper]]></surname>
<given-names><![CDATA[L.L.]]></given-names>
</name>
<name>
<surname><![CDATA[Muller]]></surname>
<given-names><![CDATA[K.E]]></given-names>
</name>
</person-group>
<source><![CDATA[Applied regression analysis and other multivariable methods]]></source>
<year>1988</year>
<edition>2</edition>
<publisher-loc><![CDATA[Belmont^eCA CA]]></publisher-loc>
<publisher-name><![CDATA[Duxbury Press]]></publisher-name>
</nlm-citation>
</ref>
<ref id="B21">
<label>21</label><nlm-citation citation-type="book">
<person-group person-group-type="author">
<name>
<surname><![CDATA[Raykov]]></surname>
<given-names><![CDATA[T.]]></given-names>
</name>
<name>
<surname><![CDATA[Marcoulides]]></surname>
<given-names><![CDATA[G.A]]></given-names>
</name>
</person-group>
<source><![CDATA[An Introduction to Applied Multivariate Analysis]]></source>
<year>2008</year>
<publisher-loc><![CDATA[New York ]]></publisher-loc>
<publisher-name><![CDATA[Taylor & Francis]]></publisher-name>
</nlm-citation>
</ref>
<ref id="B22">
<label>22</label><nlm-citation citation-type="book">
<person-group person-group-type="author">
<name>
<surname><![CDATA[Anderson]]></surname>
<given-names><![CDATA[T.W]]></given-names>
</name>
</person-group>
<source><![CDATA[An introduction to Multivariate Statistical Analysis]]></source>
<year>1984</year>
<edition>2</edition>
<publisher-loc><![CDATA[New York ]]></publisher-loc>
<publisher-name><![CDATA[Wiley]]></publisher-name>
</nlm-citation>
</ref>
<ref id="B23">
<label>23</label><nlm-citation citation-type="book">
<person-group person-group-type="author">
<name>
<surname><![CDATA[Silva Ayçaguer]]></surname>
<given-names><![CDATA[L.C]]></given-names>
</name>
</person-group>
<source><![CDATA[Diseño razonado de muestras y captación de datos para la investigación sanitaria]]></source>
<year>2000</year>
<publisher-loc><![CDATA[Madrid ]]></publisher-loc>
<publisher-name><![CDATA[Díaz de Santos]]></publisher-name>
</nlm-citation>
</ref>
<ref id="B24">
<label>24</label><nlm-citation citation-type="journal">
<person-group person-group-type="author">
<name>
<surname><![CDATA[Wilson]]></surname>
<given-names><![CDATA[I]]></given-names>
</name>
</person-group>
<article-title xml:lang="en"><![CDATA[Australian Sentinel Practice Research Network]]></article-title>
<source><![CDATA[Commun Dis Intell]]></source>
<year>2003</year>
<volume>27</volume>
<page-range>123-4</page-range></nlm-citation>
</ref>
<ref id="B25">
<label>25</label><nlm-citation citation-type="journal">
<person-group person-group-type="author">
<name>
<surname><![CDATA[Tilyard]]></surname>
<given-names><![CDATA[M]]></given-names>
</name>
<name>
<surname><![CDATA[Dovey]]></surname>
<given-names><![CDATA[S]]></given-names>
</name>
</person-group>
<article-title xml:lang="en"><![CDATA[The role of sentinel networks in general practice research in New Zealand and internationally]]></article-title>
<source><![CDATA[NZFP]]></source>
<year>1999</year>
<volume>26</volume>
</nlm-citation>
</ref>
<ref id="B26">
<label>26</label><nlm-citation citation-type="book">
<person-group person-group-type="author">
<name>
<surname><![CDATA[Van Casteren]]></surname>
<given-names><![CDATA[V]]></given-names>
</name>
</person-group>
<source><![CDATA[Belgian Sentinel general practitioners]]></source>
<year>2006</year>
<publisher-name><![CDATA[Belgium Scientific Institute of Public health]]></publisher-name>
</nlm-citation>
</ref>
<ref id="B27">
<label>27</label><nlm-citation citation-type="journal">
<person-group person-group-type="author">
<name>
<surname><![CDATA[Green]]></surname>
<given-names><![CDATA[L.A]]></given-names>
</name>
<name>
<surname><![CDATA[Miller]]></surname>
<given-names><![CDATA[R.S]]></given-names>
</name>
<name>
<surname><![CDATA[Reed]]></surname>
<given-names><![CDATA[F.M]]></given-names>
</name>
</person-group>
<article-title xml:lang="en"><![CDATA[How representative of typical practice are practice-based research networks?: A report from the Ambulatory Sentinel Practice Network Inc (ASPN)]]></article-title>
<source><![CDATA[Arch Fam Med]]></source>
<year>1993</year>
<volume>2</volume>
<page-range>939-49</page-range></nlm-citation>
</ref>
<ref id="B28">
<label>28</label><nlm-citation citation-type="journal">
<person-group person-group-type="author">
<name>
<surname><![CDATA[Lobet]]></surname>
<given-names><![CDATA[M.P]]></given-names>
</name>
<name>
<surname><![CDATA[Stroobant]]></surname>
<given-names><![CDATA[A]]></given-names>
</name>
<name>
<surname><![CDATA[Mertens]]></surname>
<given-names><![CDATA[R]]></given-names>
</name>
</person-group>
<article-title xml:lang="en"><![CDATA[Tool for validation of the network of sentinel general practitioners in the Belgian health care system]]></article-title>
<source><![CDATA[Int J Epidemiol]]></source>
<year>1987</year>
<volume>16</volume>
<page-range>612-8</page-range></nlm-citation>
</ref>
</ref-list>
</back>
</article>