<?xml version="1.0" encoding="ISO-8859-1"?><article xmlns:mml="http://www.w3.org/1998/Math/MathML" xmlns:xlink="http://www.w3.org/1999/xlink" xmlns:xsi="http://www.w3.org/2001/XMLSchema-instance">
<front>
<journal-meta>
<journal-id>1135-5727</journal-id>
<journal-title><![CDATA[Revista Española de Salud Pública]]></journal-title>
<abbrev-journal-title><![CDATA[Rev. Esp. Salud Publica]]></abbrev-journal-title>
<issn>1135-5727</issn>
<publisher>
<publisher-name><![CDATA[Ministerio de Sanidad]]></publisher-name>
</publisher>
</journal-meta>
<article-meta>
<article-id>S1135-57271999000200008</article-id>
<title-group>
<article-title xml:lang="es"><![CDATA[Efectos a corto plazo de la contaminación atmosférica sobre la mortalidad: resultados del proyecto EMECAM en dos ciudades de Asturias]]></article-title>
<article-title xml:lang="en"><![CDATA[The short-term impact of air pollution on the mortality: results of the EMECAM project in two cities in Asturias Spain]]></article-title>
</title-group>
<contrib-group>
<contrib contrib-type="author">
<name>
<surname><![CDATA[Cañada Martínez]]></surname>
<given-names><![CDATA[Alvaro]]></given-names>
</name>
<xref ref-type="aff" rid="A01"/>
</contrib>
<contrib contrib-type="author">
<name>
<surname><![CDATA[García González]]></surname>
<given-names><![CDATA[Jesús Vicente]]></given-names>
</name>
<xref ref-type="aff" rid="A02"/>
</contrib>
<contrib contrib-type="author">
<name>
<surname><![CDATA[Rodríguez Suárez]]></surname>
<given-names><![CDATA[Valentín]]></given-names>
</name>
<xref ref-type="aff" rid="A01"/>
</contrib>
<contrib contrib-type="author">
<name>
<surname><![CDATA[Fernández Noval]]></surname>
<given-names><![CDATA[Federico]]></given-names>
</name>
<xref ref-type="aff" rid="A03"/>
</contrib>
<contrib contrib-type="author">
<name>
<surname><![CDATA[Fernández Rodríguez]]></surname>
<given-names><![CDATA[Carmen]]></given-names>
</name>
<xref ref-type="aff" rid="A04"/>
</contrib>
<contrib contrib-type="author">
<name>
<surname><![CDATA[Huerta González]]></surname>
<given-names><![CDATA[Ismael]]></given-names>
</name>
<xref ref-type="aff" rid="A01"/>
</contrib>
</contrib-group>
<aff id="A01">
<institution><![CDATA[,Consejería de Servicios Sociales del Principado de Asturias  ]]></institution>
<addr-line><![CDATA[ ]]></addr-line>
</aff>
<aff id="A02">
<institution><![CDATA[,Gerencia de Atención Primaria  ]]></institution>
<addr-line><![CDATA[Gijón ]]></addr-line>
</aff>
<aff id="A03">
<institution><![CDATA[,Consejería de Servicios Sociales del Principado de Asturias  ]]></institution>
<addr-line><![CDATA[Gijón ]]></addr-line>
</aff>
<aff id="A04">
<institution><![CDATA[,Consejería de Fomento del Principado de Asturias  ]]></institution>
<addr-line><![CDATA[ ]]></addr-line>
</aff>
<pub-date pub-type="pub">
<day>00</day>
<month>03</month>
<year>1999</year>
</pub-date>
<pub-date pub-type="epub">
<day>00</day>
<month>03</month>
<year>1999</year>
</pub-date>
<volume>73</volume>
<numero>2</numero>
<fpage>187</fpage>
<lpage>197</lpage>
<copyright-statement/>
<copyright-year/>
<self-uri xlink:href="http://scielo.isciii.es/scielo.php?script=sci_arttext&amp;pid=S1135-57271999000200008&amp;lng=en&amp;nrm=iso"></self-uri><self-uri xlink:href="http://scielo.isciii.es/scielo.php?script=sci_abstract&amp;pid=S1135-57271999000200008&amp;lng=en&amp;nrm=iso"></self-uri><self-uri xlink:href="http://scielo.isciii.es/scielo.php?script=sci_pdf&amp;pid=S1135-57271999000200008&amp;lng=en&amp;nrm=iso"></self-uri><abstract abstract-type="short" xml:lang="es"><p><![CDATA[FUNDAMENTO: Los estudios realizados hasta la fecha sobre la posibilidad de que los contaminantes atmosféricos puedan tener efectos sobre la salud no han alcanzado resultados homogéneos. El estudio pretende estimar las medidas de asociación entre los niveles diarios de los contaminantes y la mortalidad a corto plazo en las 2 ciudades más pobladas de Asturias (Gijón y Oviedo), así como contribuir a aumentar el poder estadístico y la representatividad del proyecto EMECAM, en el que se enmarca. MÉTODOS: Estudio ecológico de series temporales. Estimación de niveles de exposición colectivos a partir de los valores recogidos en las estaciones de control de la contaminación. Modelado de las series de mortalidad, incluyendo variables de control, mediante regresión de Poisson. Estimación de riesgos relativos de cada contaminante para la mortalidad, controlando la autocorrelación seriada. RESULTADOS: Durante el período 1993-1996 la contaminación por partículas en suspensión y por CO fué superior en Gijón y la debida a SO2 y NO2 fué mayor en Oviedo. En ambas ciudades los niveles pueden considerarse bajos y dentro de lo admitido por la legislación. La mayoría de las estimaciones de riesgos relativos ha estado próxima al efecto nulo, aunque se han observado relaciones significativas tanto positivas (especialmente para NO2) como negativas. Las asociaciones significativas halladas no se han demostrado consistentes en ambas ciudades para los períodos estudiados. CONCLUSIONES: Con los resultados hallados en este estudio no podemos concluir una asociación clara entre los contaminantes estudiados (partículas, SO2, NO2, CO) y la mortalidad a corto plazo, al menos a los niveles detectados en Gijón y Oviedo.]]></p></abstract>
<abstract abstract-type="short" xml:lang="en"><p><![CDATA[BACKGROUND: The studies conducted to date regarding the possibility that air pollutants are capable of having impact on human health have not led to homogenous findings. This study is aimed at estimating the degrees of relationship between the daily levels of the pollutants and the death rate on a short-terms basis in the two most populated cities in Asturias (Gijón and Oviedo), as well as contributing to increasing the statistical importance and the representative nature of the EMECAM Project, within which this study is comprised. METHODS: Ecological time series study, Estimate of degrees of group exposure based on the readings taken at the pollution control stations. Modeling of the death rate series, including control variables, by means of Poisson regression. Estimating risks related to each pollutant for the death rate, controlling the series-based autocorrelation. FINDINGS: Throughout the 1993-1996 period, the pollution by means of particles in suspension and CO was greater in Gijón, that involving SO2 and NO2 having been greater in Oviedo. In these two cities, the levels can be considered to be low and to fall within what is considered admissible under the laws currently in impact. Most of the relative risk forecasts neared the zero impact point, although significant positive (especially for NO2) as well as negative relationships have been found to exist. The significant relationships found were not proven to be consistent in these two cities for the periods studied. CONCLUSIONS: Based on the findings of this study, the conclusion cannot be drawn that a clear-cut relationship exists between the pollutants studied (particles, SO2, NO2, CO) and the death rate on a short-term basis, at least at the levels detected in Gijón and Oviedo.]]></p></abstract>
<kwd-group>
<kwd lng="es"><![CDATA[Contaminación atmosférica]]></kwd>
<kwd lng="es"><![CDATA[Mortalidad]]></kwd>
<kwd lng="es"><![CDATA[Series temporales]]></kwd>
<kwd lng="en"><![CDATA[Air pollution]]></kwd>
<kwd lng="en"><![CDATA[Mortality]]></kwd>
<kwd lng="en"><![CDATA[Time series]]></kwd>
</kwd-group>
</article-meta>
</front><body><![CDATA[  <b>      <p ALIGN="CENTER"><font size="4">EFECTOS A CORTO PLAZO DE LA CONTAMINACIÓN ATMOSFÉRICA SOBRE LA MORTALIDAD: RESULTADOS DEL PROYECTO EMECAM EN DOS CIUDADES DE ASTURIAS</font></b></p>      <p ALIGN="CENTER">&nbsp;</p>      <p ALIGN="JUSTIFY"><font size="3"><strong>Alvaro Cañada Martínez (1), Jesús Vicente García González (2), Valentín Rodríguez Suárez (1), Federico Fernández Noval (3), Carmen Fernández Rodríguez (4), Ismael Huerta González (1).    <br> (1) Dirección Regional de Salud Pública. Consejería de Servicios Sociales del Principado de Asturias    <br> (2) Gerencia de Atención Primaria. Area Sanitaria V (Gijón). Insalud    <br> (3) Unidad de Salud Pública Area Sanitaria V (Gijón). Consejería de Servicios Sociales del Principado de Asturias    <br> (4) Dirección Regional de Medio Ambiente. Consejería de Fomento del Principado de Asturias</strong></font></p>      <p ALIGN="JUSTIFY"><font size="3"><strong>Correspondencia:     <br> Alvaro Cañada Martínez.     ]]></body>
<body><![CDATA[<br> Sección de Análisis e Investigación Epidemiológica. Dirección Regional de Salud Pública.    <br> c/ General Elorza, 32    <br> 33001 Oviedo    <br> Tel: 985 10 65 00 (ext 4124) Fax: 985 10 65 20     <br> Correo electrónico: <a href="mailto:alvarocm@salud.asturias.org">alvarocm@salud.asturias.org</a></strong></font></p>  <hr>  <table border="0" width="100%">   <tr>     <td valign="top" width="48%">    <p align="center"><font size="3"><b>RESUMEN</b></font></p>         <p ALIGN="JUSTIFY"><font size="3"><b>Fundamento:</b> Los estudios realizados hasta la     fecha sobre la posibilidad de que los contaminantes atmosféricos puedan tener efectos     sobre la salud no han alcanzado resultados homogéneos. El estudio pretende estimar las     medidas de asociación entre los niveles diarios de los contaminantes y la mortalidad a     corto plazo en las 2 ciudades más pobladas de Asturias (Gijón y Oviedo), así como     contribuir a aumentar el poder estadístico y la representatividad del proyecto EMECAM, en     el que se enmarca. </font></p>         <p ALIGN="JUSTIFY"><font size="3"><b>Métodos:</b> Estudio ecológico de series     temporales. Estimación de niveles de exposición colectivos a partir de los valores     recogidos en las estaciones de control de la contaminación. Modelado de las series de     mortalidad, incluyendo variables de control, mediante regresión de Poisson. Estimación     de riesgos relativos de cada contaminante para la mortalidad, controlando la     autocorrelación seriada.</font></p>         <p ALIGN="JUSTIFY"><font size="3"><b>Resultados:</b> Durante el período 1993-1996 la     contaminación por partículas en suspensión y por CO fué superior en Gijón y la debida     a SO2 y NO2 fué mayor en Oviedo. En ambas ciudades los niveles pueden considerarse bajos     y dentro de lo admitido por la legislación. La mayoría de las estimaciones de riesgos     relativos ha estado próxima al efecto nulo, aunque se han observado relaciones     significativas tanto positivas (especialmente para NO<sub>2</sub>) como negativas. Las     asociaciones significativas halladas no se han demostrado consistentes en ambas ciudades     para los períodos estudiados.</font></p>         <p ALIGN="JUSTIFY"><font size="3"><b>Conclusiones</b>: Con los resultados hallados en este     estudio no podemos concluir una asociación clara entre los contaminantes estudiados     (partículas, SO<sub>2</sub>, NO2, CO) y la mortalidad a corto plazo, al menos a los     niveles detectados en Gijón y Oviedo.</font></p>         ]]></body>
<body><![CDATA[<p><font size="3"><b>Palabras clave: </b>Contaminación atmosférica. Mortalidad. Series     temporales </font></td>     <td width="4%"></td>     <td valign="top" width="48%">    <p align="center"><font size="3"><b>ABSTRACT</b></font></p>         <p ALIGN="CENTER"><font size="3"><b>The Short-term Impact of Air Pollution on the     Mortality. Results of the EMECAM Project in two cities in Asturias Spain</b></font></p>         <p ALIGN="JUSTIFY"><font size="3"><b>Background:</b> The studies conducted to date     regarding the possibility that air pollutants are capable of having impact on human health     have not led to homogenous findings. This study is aimed at estimating the degrees of     relationship between the daily levels of the pollutants and the death rate on a     short-terms basis in the two most populated cities in Asturias (Gijón and Oviedo), as     well as contributing to increasing the statistical importance and the representative     nature of the EMECAM Project, within which this study is comprised.</font></p>         <p ALIGN="JUSTIFY"><font size="3"><b>Methods:</b> Ecological time series study, Estimate     of degrees of group exposure based on the readings taken at the pollution control     stations. Modeling of the death rate series, including control variables, by means of     Poisson regression. Estimating risks related to each pollutant for the death rate,     controlling the series-based autocorrelation.</font></p>         <p ALIGN="JUSTIFY"><font size="3"><b>Findings:</b> Throughout the 1993-1996 period, the     pollution by means of particles in suspension and CO was greater in Gijón, that involving     SO2 and NO2 having been greater in Oviedo. In these two cities, the levels can be     considered to be low and to fall within what is considered admissible under the laws     currently in impact. Most of the relative risk forecasts neared the zero impact point,     although significant positive (especially for NO2) as well as negative relationships have     been found to exist. The significant relationships found were not proven to be consistent     in these two cities for the periods studied.</font></p>         <p ALIGN="JUSTIFY"><font size="3"><b>Conclusions:</b> Based on the findings of this study,     the conclusion cannot be drawn that a clear-cut relationship exists between the pollutants     studied (particles, SO2, NO2, CO) and the death rate on a short-term basis, at least at     the levels detected in Gijón and Oviedo.</font></p>         <p ALIGN="JUSTIFY"><font size="3"><b>Key words:</b> Air pollution. Mortality. Time series.</font></td>   </tr> </table>  <hr>      <p ALIGN="CENTER"><font size="4"><b>INTRODUCCIÓN</b></font></p>      <p ALIGN="JUSTIFY"><font size="3">Desde mediados del presente siglo se ha intensificado el estudio de los efectos de la contaminación atmosférica sobre la salud<sup>1</sup>. En los últimos años se están investigando los efectos a corto plazo sobre la salud de niveles de contaminación moderados<sup>2-11</sup>.</font></p>      ]]></body>
<body><![CDATA[<p ALIGN="JUSTIFY"><font size="3">En Asturias se han elaborado varios informes sobre la situación de la contaminación atmosférica y sobre las relaciones entre calidad del aire y salud<sup>12</sup>, pero hasta ahora no se había abordado específicamente la posible relación a corto plazo entre contaminación y mortalidad.</font></p>      <p ALIGN="JUSTIFY"><font size="3">La existencia en Asturias de una Red de Vigilancia de la Calidad del Aire y de un Registro de Mortalidad permite una aproximación al problema a través de investigaciones de correlación entre ambas variables. El objetivo del presente estudio es investigar la posible relación a corto plazo entre cada uno de los contaminantes y la mortalidad, tomando como unidad de análisis cada día del período estudiado, y realizar estimaciones de las medidas de asociación. Asimismo, se pretende colaborar a aumentar la potencia estadística y la representatividad geográfica del proyecto EMECAM, aportando los datos para el análisis conjunto de las 14 ciudades.</font></p>      <p ALIGN="JUSTIFY"><font size="3">Los requisitos establecidos en el protocolo de estudio en cuanto a población, número de estaciones de control de la contaminación y período de tiempo mínimo, han llevado a seleccionar para este trabajo las ciudades de Oviedo y Gijón entre los años 1993 y 1996. Se valoró inicialmente la posibilidad de incluir otras ciudades asturianas, algunas de ellas con importante desarrollo industrial, pero el número de habitantes y, por tanto, de fallecimientos, era demasiado reducido para los criterios antedichos.</font></p> <b>      <p ALIGN="JUSTIFY">&nbsp;</p>      <p ALIGN="CENTER"><font size="4">MATERIAL Y MÉTODOS</font></b></p>      <p ALIGN="JUSTIFY"><font size="3">Se trata de un estudio ecológico de series temporales. Se han analizado las defunciones ocurridas entre el 1 de Enero de 1993 y el 31 de Diciembre de 1996, en Oviedo y Gijón, de personas residentes en estas mismas ciudades. Según el padrón de 1996, Gijón tenía 264.381 habitantes y Oviedo 200.049.</font></p>      <p ALIGN="JUSTIFY"><font size="3">Las variables analizadas, todas ellas recogidas con desagregación diaria, fueron las siguientes: mortalidad por causas, niveles de contaminación atmosférica por dióxido de azufre (SO<sub>2</sub>), dióxido de nitrógeno (NO<sub>2</sub>), monóxido de carbono (CO), partículas en suspensión medidas como humos negros (PSUS) y partículas totales en suspensión (PST). Además, se han utilizado como variables de control las siguientes: temperatura media, humedad relativa, incidencia de gripe y variables temporales (tendencia, cambios cíclicos a través de términos sinusoidales, día de la semana, semestre, año, días festivos y otros días &quot;excepcionales&quot;), basándose en el conocimiento o la sospecha de su relación con la variable estudiada (mortalidad) a través de diferentes investigaciones anteriores.</font></p>      <p ALIGN="JUSTIFY"><font size="3">Las fuentes de información han sido las siguientes: </font></p>      <p ALIGN="JUSTIFY"><font size="3">La <b>mortalidad</b> (variable resultado) se ha obtenido del Registro de Mortalidad de la Dirección Regional de Salud Pública del Principado de Asturias. Los datos de contaminación proceden de la Red de Vigilancia de la Contaminación Atmosférica, gestionada por la Dirección Regional de Medio Ambiente del Principado de Asturias, que integra la información de su propia red automática y la que recibe de las redes manuales municipales. La información sobre temperatura y humedad procede del Instituto Nacional de Meteorología (INM). Los datos de incidencia de gripe han sido aportados por el Sistema de Vigilancia Epidemiológica de la Dirección Regional de Salud Pública.</font></p>      <p ALIGN="JUSTIFY"><font size="3">La mortalidad se analizó en 4 categorías (no mutuamente excluyentes): todas las causas, excepto las externas (Clasificación Internacional de Enfermedades, 9ª revisión <sup>13</sup> (CIE-9) 001-799), todas las causas excepto las externas en personas de 70 y más años de edad, causas respiratorias (CIE-9 460-519) y causas cardiovasculares (CIE-9 390-459).</font></p>      ]]></body>
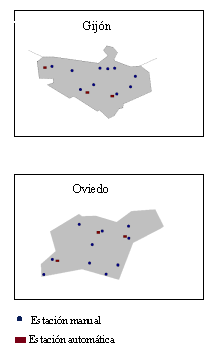
<body><![CDATA[<p ALIGN="JUSTIFY"><font size="3">La red manual de medición de la contaminación presenta valores diarios. La red automática presenta los datos integrados cada 15 minutos. Se han calculado los valores horarios como las medias de los 4 valores recogidos cada hora y se han obtenido los valores medios diarios y, para el SO<sub>2</sub> y el NO<sub>2</sub>, los valores horarios máximos de cada día. </font></p>      <p ALIGN="JUSTIFY"><font size="3">La estimación de la exposición diaria de la población a cada contaminante se valoró como el promedio de las mediciones de cada una de las estaciones. </font></p>      <p ALIGN="JUSTIFY"><font size="3">La temperatura media diaria ofrecida por el INM se calcula como la media simple entre los valores horarios mínimo y máximo. La humedad relativa como el promedio de 3 determinaciones diarias: a las 7, 13 y 18 horas solares.</font></p>      <p ALIGN="JUSTIFY"><font size="3">Para el período a estudio se disponía inicialmente de información de 3 estaciones automáticas y 13 manuales en Oviedo y 4 estaciones automáticas y 10 manuales en Gijón. Tras la aplicación de los criterios de exclusión establecidos en el protocolo EMECAM, se eliminaron algunas de ellas para determinados contaminantes, por lo que finalmente se trabajó con 3 estaciones automáticas en ambas ciudades, además de las siguientes estaciones manuales: 10 en Gijón y 9 en Oviedo para partículas en suspensión y 9 en Gijón y 7 en Oviedo para SO2.</font></p>      <p ALIGN="JUSTIFY"><font size="3">Las estaciones están distribuídas geográficamente de modo que recogen datos de contaminación de toda el área urbana en ambas ciudades (<a href="#fig1">figura 1</a>).</font></p>      <p><a name="fig1"></a></p>      <p align="center"><font size="3"><strong>Figura 1    <br> Ubicación de las estaciones incluídas en el estudio</strong></font></p>      <p ALIGN="center"><!-- big --><!-- big --><img src="/img/fbpe/resp/v73n2/ast1.gif" alt="ast1.gif (4471 bytes)"><!-- /big --><!-- /big --></p>      
<p ALIGN="CENTER">&nbsp; </p>      ]]></body>
<body><![CDATA[<p ALIGN="CENTER"><font size="4"><b>RESULTADOS</b></font></p>      <p ALIGN="JUSTIFY"><font size="3">El promedio diario de fallecimientos por todas las causas (excluyendo las externas) entre los residentes en el municipio, que ocurrieron en el propio municipio, fué de 6,3 en Gijón y 4,5 en Oviedo.</font></p>      <p ALIGN="JUSTIFY"><font size="3">Las correlaciones entre las diferentes estaciones captadoras que medían un mismo contaminante y que fueron finalmente incluidas, son siempre mayores de 0,5, excepto en el caso del NO<sub>2</sub> en Gijón (tanto en el promedio diario como en el máximo horario), que presenta correlaciones muy bajas. Las correlaciones entre los contaminantes (series promedio definitivas) se presentan en la <a href="#tab1">tabla 1</a>. Se han comprobado también las correlaciones entre las mediciones de SO<sub>2</sub> en los casos en los que hay una estación manual y otra automática ubicadas en el mismo lugar o muy próximas (2 en Oviedo y 3 en Gijón), hallándose valores de los coeficientes que oscilan entre 0,34 y 0,54.</font></p>      <p ALIGN="JUSTIFY"><a name="tab1"></a>&nbsp; </p>      <p ALIGN="CENTER"><font size="3"><strong>Tabla 1    <br> Correlaciones entre contaminantes en Gijón y Oviedo</strong></font></p>     <div align="center">    <center>  <table BORDER="0" CELLSPACING="1" bgcolor="#ECECEC">   <tr>     <td VALIGN="top" bgcolor="#C0C0C0">    <p ALIGN="JUSTIFY"><font size="3"><b>GIJÓN</b></font></td>     <td VALIGN="top" bgcolor="#C0C0C0">    <p ALIGN="JUSTIFY"><font size="3">PSUS</font></td>     <td VALIGN="top" bgcolor="#C0C0C0">    ]]></body>
<body><![CDATA[<p ALIGN="JUSTIFY"><font size="3">PST</font></td>     <td VALIGN="top" bgcolor="#C0C0C0">    <p ALIGN="JUSTIFY"><font size="3">SO2 man</font></td>     <td VALIGN="top" bgcolor="#C0C0C0">    <p ALIGN="JUSTIFY"><font size="3">SO2 auto</font></td>     <td VALIGN="top" bgcolor="#C0C0C0">    <p ALIGN="JUSTIFY"><font size="3">SO2 máx</font></td>     <td VALIGN="top" bgcolor="#C0C0C0">    <p ALIGN="JUSTIFY"><font size="3">NO2</font></td>     <td VALIGN="top" bgcolor="#C0C0C0">    <p ALIGN="JUSTIFY"><font size="3">NO2 máx</font></td>   </tr>   <tr>     <td VALIGN="top">    <p ALIGN="JUSTIFY"><font size="3">PST</font></td>     <td VALIGN="top">    <p ALIGN="JUSTIFY"><font size="3">0.63</font></td>     <td VALIGN="top">&nbsp; </td>     <td VALIGN="top">&nbsp; </td>     <td VALIGN="top">&nbsp; </td>     <td VALIGN="top">&nbsp; </td>     <td VALIGN="top">&nbsp; </td>     <td VALIGN="top">&nbsp; </td>   </tr>   <tr>     <td VALIGN="top">    <p ALIGN="JUSTIFY"><font size="3">SO2 (manual)</font></td>     <td VALIGN="top">    <p ALIGN="JUSTIFY"><font size="3">0.61</font></td>     <td VALIGN="top">    ]]></body>
<body><![CDATA[<p ALIGN="JUSTIFY"><font size="3">0.43</font></td>     <td VALIGN="top">&nbsp; </td>     <td VALIGN="top">&nbsp; </td>     <td VALIGN="top">&nbsp; </td>     <td VALIGN="top">&nbsp; </td>     <td VALIGN="top">&nbsp; </td>   </tr>   <tr>     <td VALIGN="top">    <p ALIGN="JUSTIFY"><font size="3">SO2 (automát)</font></td>     <td VALIGN="top">    <p ALIGN="JUSTIFY"><font size="3">0.55</font></td>     <td VALIGN="top">    <p ALIGN="JUSTIFY"><font size="3">0.64</font></td>     <td VALIGN="top">    <p ALIGN="JUSTIFY"><font size="3">0.52</font></td>     <td VALIGN="top">&nbsp; </td>     <td VALIGN="top">&nbsp;&nbsp; </td>     <td VALIGN="top">&nbsp; </td>     <td VALIGN="top">&nbsp; </td>   </tr>   <tr>     <td VALIGN="top">    <p ALIGN="JUSTIFY"><font size="3">SO2 máximo</font></td>     <td VALIGN="top">    <p ALIGN="JUSTIFY"><font size="3">0.35</font></td>     <td VALIGN="top">    <p ALIGN="JUSTIFY"><font size="3">0.50</font></td>     <td VALIGN="top">    <p ALIGN="JUSTIFY"><font size="3">0.38</font></td>     <td VALIGN="top">    <p ALIGN="JUSTIFY"><font size="3">0.86</font></td>     <td VALIGN="top">&nbsp; </td>     <td VALIGN="top">&nbsp; </td>     <td VALIGN="top">&nbsp;&nbsp; </td>   </tr>   <tr>     <td VALIGN="top">    ]]></body>
<body><![CDATA[<p ALIGN="JUSTIFY"><font size="3">NO2</font></td>     <td VALIGN="top">    <p ALIGN="JUSTIFY"><font size="3">0.38</font></td>     <td VALIGN="top">    <p ALIGN="JUSTIFY"><font size="3">0.45</font></td>     <td VALIGN="top">    <p ALIGN="JUSTIFY"><font size="3">0.28</font></td>     <td VALIGN="top">    <p ALIGN="JUSTIFY"><font size="3">0.38</font></td>     <td VALIGN="top">    <p ALIGN="JUSTIFY"><font size="3">0.29</font></td>     <td VALIGN="top">&nbsp; </td>     <td VALIGN="top">&nbsp; </td>   </tr>   <tr>     <td VALIGN="top">    <p ALIGN="JUSTIFY"><font size="3">NO2 máximo</font></td>     <td VALIGN="top">    <p ALIGN="JUSTIFY"><font size="3">0.46</font></td>     <td VALIGN="top">    <p ALIGN="JUSTIFY"><font size="3">0.54</font></td>     <td VALIGN="top">    <p ALIGN="JUSTIFY"><font size="3">0.33</font></td>     <td VALIGN="top">    ]]></body>
<body><![CDATA[<p ALIGN="JUSTIFY"><font size="3">0.43</font></td>     <td VALIGN="top">    <p ALIGN="JUSTIFY"><font size="3">0.36</font></td>     <td VALIGN="top">    <p ALIGN="JUSTIFY"><font size="3">0.85</font></td>     <td VALIGN="top">&nbsp; </td>   </tr>   <tr>     <td VALIGN="top">    <p ALIGN="JUSTIFY"><font size="3">CO</font></td>     <td VALIGN="top">    <p ALIGN="JUSTIFY"><font size="3">0.58</font></td>     <td VALIGN="top">    <p ALIGN="JUSTIFY"><font size="3">0.62</font></td>     <td VALIGN="top">    <p ALIGN="JUSTIFY"><font size="3">0.34</font></td>     <td VALIGN="top">    <p ALIGN="JUSTIFY"><font size="3">0.61</font></td>     <td VALIGN="top">    <p ALIGN="JUSTIFY"><font size="3">0.47</font></td>     <td VALIGN="top">    <p ALIGN="JUSTIFY"><font size="3">0.37</font></td>     <td VALIGN="top">    ]]></body>
<body><![CDATA[<p ALIGN="JUSTIFY"><font size="3">0.51</font></td>   </tr> </table> </center></div>      <p ALIGN="JUSTIFY">&nbsp;</p>     <div align="center">    <center>  <table BORDER="0" CELLSPACING="1" bgcolor="#ECECEC">   <tr>     <td VALIGN="top" bgcolor="#C0C0C0"><b>    <p ALIGN="JUSTIFY"><font size="3">OVIEDO</font></b></td>     <td VALIGN="top" bgcolor="#C0C0C0">    <p ALIGN="JUSTIFY"><font size="3">PSUS</font></td>     <td VALIGN="top" bgcolor="#C0C0C0">    <p ALIGN="JUSTIFY"><font size="3">PST</font></td>     <td VALIGN="top" bgcolor="#C0C0C0">    <p ALIGN="JUSTIFY"><font size="3">SO2 man</font></td>     <td VALIGN="top" bgcolor="#C0C0C0">    <p ALIGN="JUSTIFY"><font size="3">SO2 auto</font></td>     <td VALIGN="top" bgcolor="#C0C0C0">    <p ALIGN="JUSTIFY"><font size="3">SO2 máx</font></td>     <td VALIGN="top" bgcolor="#C0C0C0">    ]]></body>
<body><![CDATA[<p ALIGN="JUSTIFY"><font size="3">NO2</font></td>     <td VALIGN="top" bgcolor="#C0C0C0">    <p ALIGN="JUSTIFY"><font size="3">NO2 máx</font></td>   </tr>   <tr>     <td VALIGN="top">    <p ALIGN="JUSTIFY"><font size="3">PST</font></td>     <td VALIGN="top">    <p ALIGN="JUSTIFY"><font size="3">0.55</font></td>     <td VALIGN="top">&nbsp; </td>     <td VALIGN="top">&nbsp; </td>     <td VALIGN="top">&nbsp; </td>     <td VALIGN="top">&nbsp; </td>     <td VALIGN="top">&nbsp; </td>     <td VALIGN="top">&nbsp; </td>   </tr>   <tr>     <td VALIGN="top">    <p ALIGN="JUSTIFY"><font size="3">SO2 (manual)</font></td>     <td VALIGN="top">    <p ALIGN="JUSTIFY"><font size="3">0.75</font></td>     <td VALIGN="top">    <p ALIGN="JUSTIFY"><font size="3">0.46</font></td>     <td VALIGN="top">&nbsp; </td>     <td VALIGN="top">&nbsp; </td>     <td VALIGN="top">&nbsp;&nbsp; </td>     <td VALIGN="top">&nbsp; </td>     <td VALIGN="top">&nbsp; </td>   </tr>   <tr>     <td VALIGN="top">    <p ALIGN="JUSTIFY"><font size="3">SO2 (automát)</font></td>     <td VALIGN="top">    <p ALIGN="JUSTIFY"><font size="3">0.69</font></td>     <td VALIGN="top">    <p ALIGN="JUSTIFY"><font size="3">0.68</font></td>     <td VALIGN="top">    ]]></body>
<body><![CDATA[<p ALIGN="JUSTIFY"><font size="3">0.60</font></td>     <td VALIGN="top">&nbsp; </td>     <td VALIGN="top">&nbsp; </td>     <td VALIGN="top">&nbsp; </td>     <td VALIGN="top">&nbsp; </td>   </tr>   <tr>     <td VALIGN="top">    <p ALIGN="JUSTIFY"><font size="3">SO2 máximo</font></td>     <td VALIGN="top">    <p ALIGN="JUSTIFY"><font size="3">0.55</font></td>     <td VALIGN="top">    <p ALIGN="JUSTIFY"><font size="3">0.63</font></td>     <td VALIGN="top">    <p ALIGN="JUSTIFY"><font size="3">0.51</font></td>     <td VALIGN="top">    <p ALIGN="JUSTIFY"><font size="3">0.90</font></td>     <td VALIGN="top">&nbsp; </td>     <td VALIGN="top">&nbsp; </td>     <td VALIGN="top">&nbsp; </td>   </tr>   <tr>     <td VALIGN="top">    <p ALIGN="JUSTIFY"><font size="3">NO2</font></td>     <td VALIGN="top">    <p ALIGN="JUSTIFY"><font size="3">0.58</font></td>     <td VALIGN="top">    <p ALIGN="JUSTIFY"><font size="3">0.61</font></td>     <td VALIGN="top">    <p ALIGN="JUSTIFY"><font size="3">0.52</font></td>     <td VALIGN="top">    ]]></body>
<body><![CDATA[<p ALIGN="JUSTIFY"><font size="3">0.72</font></td>     <td VALIGN="top">    <p ALIGN="JUSTIFY"><font size="3">0.63</font></td>     <td VALIGN="top">&nbsp; </td>     <td VALIGN="top">&nbsp; </td>   </tr>   <tr>     <td VALIGN="top">    <p ALIGN="JUSTIFY"><font size="3">NO2 máximo</font></td>     <td VALIGN="top">    <p ALIGN="JUSTIFY"><font size="3">0.44</font></td>     <td VALIGN="top">    <p ALIGN="JUSTIFY"><font size="3">0.51</font></td>     <td VALIGN="top">    <p ALIGN="JUSTIFY"><font size="3">0.42</font></td>     <td VALIGN="top">    <p ALIGN="JUSTIFY"><font size="3">0.56</font></td>     <td VALIGN="top">    <p ALIGN="JUSTIFY"><font size="3">0.52</font></td>     <td VALIGN="top">    <p ALIGN="JUSTIFY"><font size="3">0.84</font></td>     <td VALIGN="top">&nbsp; </td>   </tr>   <tr>     <td VALIGN="top">    <p ALIGN="JUSTIFY"><font size="3">CO</font></td>     <td VALIGN="top">    ]]></body>
<body><![CDATA[<p ALIGN="JUSTIFY"><font size="3">0.80</font></td>     <td VALIGN="top">    <p ALIGN="JUSTIFY"><font size="3">0.61</font></td>     <td VALIGN="top">    <p ALIGN="JUSTIFY"><font size="3">0.57</font></td>     <td VALIGN="top">    <p ALIGN="JUSTIFY"><font size="3">0.73</font></td>     <td VALIGN="top">    <p ALIGN="JUSTIFY"><font size="3">0.62</font></td>     <td VALIGN="top">    <p ALIGN="JUSTIFY"><font size="3">0.67</font></td>     <td VALIGN="top">    <p ALIGN="JUSTIFY"><font size="3">0.56</font></td>   </tr> </table> </center></div>      <p ALIGN="JUSTIFY"><font size="3">En la <a href="#tab2">tabla 2</a> presentamos los estadísticos descriptivos de los niveles de contaminación y de las variables de mortalidad y de control.</font></p>      <p ALIGN="JUSTIFY"><a name="tab2"></a></p>      <p ALIGN="CENTER"><font size="3"><strong>Tabla 2    ]]></body>
<body><![CDATA[<br> Estadísticos descriptivos de las variables estudiadas, en unidades/día.</strong></font></p>     <div align="center">    <center>  <table BORDER="0" CELLSPACING="1" bgcolor="#ECECEC">   <tr>     <td VALIGN="top" bgcolor="#C0C0C0"><small>&nbsp; </small></td>     <td VALIGN="top" COLSPAN="2" bgcolor="#C0C0C0"><b>    <p ALIGN="CENTER"><font size="2">MEDIA</font></b></td>     <td VALIGN="top" COLSPAN="2" bgcolor="#C0C0C0"><b>    <p ALIGN="CENTER"><font size="2">P10</font></b></td>     <td VALIGN="top" COLSPAN="2" bgcolor="#C0C0C0"><b>    <p ALIGN="CENTER"><font size="2">MEDIANA</font></b></td>     <td VALIGN="top" COLSPAN="2" bgcolor="#C0C0C0"><b>    <p ALIGN="CENTER"><font size="2">P90</font></b></td>     <td VALIGN="top" COLSPAN="2" bgcolor="#C0C0C0"><b>    <p ALIGN="CENTER"><font size="2">MEDIA     SEMEST FRÍO</font></b></td>     <td VALIGN="top" COLSPAN="2" bgcolor="#C0C0C0"><b>    <p ALIGN="CENTER"><font size="2">MEDIA     SEMEST CÁLIDO</font></b></td>   </tr>   <tr>     <td VALIGN="top" bgcolor="#C0C0C0"><small>&nbsp; </small></td>     <td VALIGN="top" bgcolor="#C0C0C0">    <p ALIGN="CENTER"><font size="2">GIJÓN</font></td>     <td VALIGN="top" bgcolor="#C0C0C0">    ]]></body>
<body><![CDATA[<p ALIGN="CENTER"><font size="2">OVIEDO</font></td>     <td VALIGN="top" bgcolor="#C0C0C0">    <p ALIGN="CENTER"><font size="2">GIJÓN</font></td>     <td VALIGN="top" bgcolor="#C0C0C0">    <p ALIGN="CENTER"><font size="2">OVIEDO</font></td>     <td VALIGN="top" bgcolor="#C0C0C0">    <p ALIGN="CENTER"><font size="2">GIJÓN</font></td>     <td VALIGN="top" bgcolor="#C0C0C0">    <p ALIGN="CENTER"><font size="2">OVIEDO</font></td>     <td VALIGN="top" bgcolor="#C0C0C0">    <p ALIGN="CENTER"><font size="2">GIJÓN</font></td>     <td VALIGN="top" bgcolor="#C0C0C0">    <p ALIGN="CENTER"><font size="2">OVIEDO</font></td>     <td VALIGN="top" bgcolor="#C0C0C0">    <p ALIGN="CENTER"><font size="2">GIJÓN</font></td>     <td VALIGN="top" bgcolor="#C0C0C0">    <p ALIGN="CENTER"><font size="2">OVIEDO</font></td>     <td VALIGN="top" bgcolor="#C0C0C0">    <p ALIGN="CENTER"><font size="2">GIJÓN</font></td>     <td VALIGN="top" bgcolor="#C0C0C0">    ]]></body>
<body><![CDATA[<p ALIGN="CENTER"><font size="2">OVIEDO</font></td>   </tr>   <tr>     <td VALIGN="top">    <p ALIGN="JUSTIFY"><font size="2">MORT TODAS NO EXT (n)</font></td>     <td VALIGN="top">    <p ALIGN="RIGHT"><font size="2">6.3</font></td>     <td VALIGN="top">    <p ALIGN="RIGHT"><font size="2">4.5</font></td>     <td VALIGN="top">    <p ALIGN="RIGHT"><font size="2">3</font></td>     <td VALIGN="top">    <p ALIGN="RIGHT"><font size="2">2</font></td>     <td VALIGN="top">    <p ALIGN="RIGHT"><font size="2">6</font></td>     <td VALIGN="top">    <p ALIGN="RIGHT"><font size="2">4</font></td>     <td VALIGN="top">    <p ALIGN="RIGHT"><font size="2">10</font></td>     <td VALIGN="top">    <p ALIGN="RIGHT"><font size="2">7</font></td>     <td VALIGN="top">    ]]></body>
<body><![CDATA[<p ALIGN="RIGHT"><font size="2">7.1</font></td>     <td VALIGN="top">    <p ALIGN="RIGHT"><font size="2">4.9</font></td>     <td VALIGN="top">    <p ALIGN="RIGHT"><font size="2">5.6</font></td>     <td VALIGN="top">    <p ALIGN="RIGHT"><font size="2">4.1</font></td>   </tr>   <tr>     <td VALIGN="top">    <p ALIGN="JUSTIFY"><font size="2">MORT TODAS NO EXT 70+ (n)</font></td>     <td VALIGN="top">    <p ALIGN="RIGHT"><font size="2">4.7</font></td>     <td VALIGN="top">    <p ALIGN="RIGHT"><font size="2">3.3</font></td>     <td VALIGN="top">    <p ALIGN="RIGHT"><font size="2">2</font></td>     <td VALIGN="top">    <p ALIGN="RIGHT"><font size="2">1</font></td>     <td VALIGN="top">    <p ALIGN="RIGHT"><font size="2">4</font></td>     <td VALIGN="top">    ]]></body>
<body><![CDATA[<p ALIGN="RIGHT"><font size="2">3</font></td>     <td VALIGN="top">    <p ALIGN="RIGHT"><font size="2">8</font></td>     <td VALIGN="top">    <p ALIGN="RIGHT"><font size="2">6</font></td>     <td VALIGN="top">    <p ALIGN="RIGHT"><font size="2">5.3</font></td>     <td VALIGN="top">    <p ALIGN="RIGHT"><font size="2">3.6</font></td>     <td VALIGN="top">    <p ALIGN="RIGHT"><font size="2">4.1</font></td>     <td VALIGN="top">    <p ALIGN="RIGHT"><font size="2">3.0</font></td>   </tr>   <tr>     <td VALIGN="top">    <p ALIGN="JUSTIFY"><font size="2">MORT RESPIRATORIA (n)</font></td>     <td VALIGN="top">    <p ALIGN="RIGHT"><font size="2">0.7</font></td>     <td VALIGN="top">    <p ALIGN="RIGHT"><font size="2">0.5</font></td>     <td VALIGN="top">    ]]></body>
<body><![CDATA[<p ALIGN="RIGHT"><font size="2">0</font></td>     <td VALIGN="top">    <p ALIGN="RIGHT"><font size="2">0</font></td>     <td VALIGN="top">    <p ALIGN="RIGHT"><font size="2">0</font></td>     <td VALIGN="top">    <p ALIGN="RIGHT"><font size="2">0</font></td>     <td VALIGN="top">    <p ALIGN="RIGHT"><font size="2">2</font></td>     <td VALIGN="top">    <p ALIGN="RIGHT"><font size="2">1</font></td>     <td VALIGN="top">    <p ALIGN="RIGHT"><font size="2">0.9</font></td>     <td VALIGN="top">    <p ALIGN="RIGHT"><font size="2">0.6</font></td>     <td VALIGN="top">    <p ALIGN="RIGHT"><font size="2">0.5</font></td>     <td VALIGN="top">    <p ALIGN="RIGHT"><font size="2">0.4</font></td>   </tr>   <tr>     <td VALIGN="top">    ]]></body>
<body><![CDATA[<p ALIGN="JUSTIFY"><font size="2">MORT CARDIOCIRCULAT (n)</font></td>     <td VALIGN="top">    <p ALIGN="RIGHT"><font size="2">2.2</font></td>     <td VALIGN="top">    <p ALIGN="RIGHT"><font size="2">1.5</font></td>     <td VALIGN="top">    <p ALIGN="RIGHT"><font size="2">0</font></td>     <td VALIGN="top">    <p ALIGN="RIGHT"><font size="2">0</font></td>     <td VALIGN="top">    <p ALIGN="RIGHT"><font size="2">2</font></td>     <td VALIGN="top">    <p ALIGN="RIGHT"><font size="2">1</font></td>     <td VALIGN="top">    <p ALIGN="RIGHT"><font size="2">4</font></td>     <td VALIGN="top">    <p ALIGN="RIGHT"><font size="2">3</font></td>     <td VALIGN="top">    <p ALIGN="RIGHT"><font size="2">2.5</font></td>     <td VALIGN="top">    ]]></body>
<body><![CDATA[<p ALIGN="RIGHT"><font size="2">1.7</font></td>     <td VALIGN="top">    <p ALIGN="RIGHT"><font size="2">2.0</font></td>     <td VALIGN="top">    <p ALIGN="RIGHT"><font size="2">1.4</font></td>   </tr>   <tr>     <td VALIGN="top">    <p ALIGN="JUSTIFY"><font size="2">PSUS (m g/m<sup>3</sup>)</font></td>     <td VALIGN="top">    <p ALIGN="RIGHT"><font size="2">52.0</font></td>     <td VALIGN="top">    <p ALIGN="RIGHT"><font size="2">28.9</font></td>     <td VALIGN="top">    <p ALIGN="RIGHT"><font size="2">25.3</font></td>     <td VALIGN="top">    <p ALIGN="RIGHT"><font size="2">11.7</font></td>     <td VALIGN="top">    <p ALIGN="RIGHT"><font size="2">45.1</font></td>     <td VALIGN="top">    <p ALIGN="RIGHT"><font size="2">20.8</font></td>     <td VALIGN="top">    ]]></body>
<body><![CDATA[<p ALIGN="RIGHT"><font size="2">86.0</font></td>     <td VALIGN="top">    <p ALIGN="RIGHT"><font size="2">59.5</font></td>     <td VALIGN="top">    <p ALIGN="RIGHT"><font size="2">66.9</font></td>     <td VALIGN="top">    <p ALIGN="RIGHT"><font size="2">40.3</font></td>     <td VALIGN="top">    <p ALIGN="RIGHT"><font size="2">37.8</font></td>     <td VALIGN="top">    <p ALIGN="RIGHT"><font size="2">17.6</font></td>   </tr>   <tr>     <td VALIGN="top">    <p ALIGN="JUSTIFY"><font size="2">SO2 manual (m g/m<sup>3</sup>)</font></td>     <td VALIGN="top">    <p ALIGN="RIGHT"><font size="2">24.6</font></td>     <td VALIGN="top">    <p ALIGN="RIGHT"><font size="2">25.4</font></td>     <td VALIGN="top">    <p ALIGN="RIGHT"><font size="2">11.2</font></td>     <td VALIGN="top">    ]]></body>
<body><![CDATA[<p ALIGN="RIGHT"><font size="2">11.9</font></td>     <td VALIGN="top">    <p ALIGN="RIGHT"><font size="2">19.3</font></td>     <td VALIGN="top">    <p ALIGN="RIGHT"><font size="2">21.6</font></td>     <td VALIGN="top">    <p ALIGN="RIGHT"><font size="2">44.8</font></td>     <td VALIGN="top">    <p ALIGN="RIGHT"><font size="2">44.0</font></td>     <td VALIGN="top">    <p ALIGN="RIGHT"><font size="2">31.7</font></td>     <td VALIGN="top">    <p ALIGN="RIGHT"><font size="2">32.5</font></td>     <td VALIGN="top">    <p ALIGN="RIGHT"><font size="2">17.8</font></td>     <td VALIGN="top">    <p ALIGN="RIGHT"><font size="2">17.6</font></td>   </tr>   <tr>     <td VALIGN="top">    <p ALIGN="JUSTIFY"><font size="2">SO2 auto (m g/m<sup>3</sup>)</font></td>     <td VALIGN="top">    ]]></body>
<body><![CDATA[<p ALIGN="RIGHT"><font size="2">34.1</font></td>     <td VALIGN="top">    <p ALIGN="RIGHT"><font size="2">44.5</font></td>     <td VALIGN="top">    <p ALIGN="RIGHT"><font size="2">11.3</font></td>     <td VALIGN="top">    <p ALIGN="RIGHT"><font size="2">18.3</font></td>     <td VALIGN="top">    <p ALIGN="RIGHT"><font size="2">28.7</font></td>     <td VALIGN="top">    <p ALIGN="RIGHT"><font size="2">37.7</font></td>     <td VALIGN="top">    <p ALIGN="RIGHT"><font size="2">63.9</font></td>     <td VALIGN="top">    <p ALIGN="RIGHT"><font size="2">81.9</font></td>     <td VALIGN="top">    <p ALIGN="RIGHT"><font size="2">42.4</font></td>     <td VALIGN="top">    <p ALIGN="RIGHT"><font size="2">55.4</font></td>     <td VALIGN="top">    ]]></body>
<body><![CDATA[<p ALIGN="RIGHT"><font size="2">26.0</font></td>     <td VALIGN="top">    <p ALIGN="RIGHT"><font size="2">33.7</font></td>   </tr>   <tr>     <td VALIGN="top">    <p ALIGN="JUSTIFY"><font size="2">SO2 máximo horario (m g/m<sup>3</sup>)</font></td>     <td VALIGN="top">    <p ALIGN="RIGHT"><font size="2">87.8</font></td>     <td VALIGN="top">    <p ALIGN="RIGHT"><font size="2">103.5</font></td>     <td VALIGN="top">    <p ALIGN="RIGHT"><font size="2">27.1</font></td>     <td VALIGN="top">    <p ALIGN="RIGHT"><font size="2">37.1</font></td>     <td VALIGN="top">    <p ALIGN="RIGHT"><font size="2">75.0</font></td>     <td VALIGN="top">    <p ALIGN="RIGHT"><font size="2">88.3</font></td>     <td VALIGN="top">    <p ALIGN="RIGHT"><font size="2">168.6</font></td>     <td VALIGN="top">    ]]></body>
<body><![CDATA[<p ALIGN="RIGHT"><font size="2">192.6</font></td>     <td VALIGN="top">    <p ALIGN="RIGHT"><font size="2">99.1</font></td>     <td VALIGN="top">    <p ALIGN="RIGHT"><font size="2">123.7</font></td>     <td VALIGN="top">    <p ALIGN="RIGHT"><font size="2">76.8</font></td>     <td VALIGN="top">    <p ALIGN="RIGHT"><font size="2">83.6</font></td>   </tr>   <tr>     <td VALIGN="top">    <p ALIGN="JUSTIFY"><font size="2">PST (m g/m<sup>3</sup>)</font></td>     <td VALIGN="top">    <p ALIGN="RIGHT"><font size="2">82.9</font></td>     <td VALIGN="top">    <p ALIGN="RIGHT"><font size="2">79.1</font></td>     <td VALIGN="top">    <p ALIGN="RIGHT"><font size="2">51.4</font></td>     <td VALIGN="top">    <p ALIGN="RIGHT"><font size="2">52.7</font></td>     <td VALIGN="top">    ]]></body>
<body><![CDATA[<p ALIGN="RIGHT"><font size="2">75.0</font></td>     <td VALIGN="top">    <p ALIGN="RIGHT"><font size="2">73.0</font></td>     <td VALIGN="top">    <p ALIGN="RIGHT"><font size="2">127.0</font></td>     <td VALIGN="top">    <p ALIGN="RIGHT"><font size="2">116.0</font></td>     <td VALIGN="top">    <p ALIGN="RIGHT"><font size="2">92.7</font></td>     <td VALIGN="top">    <p ALIGN="RIGHT"><font size="2">83.6</font></td>     <td VALIGN="top">    <p ALIGN="RIGHT"><font size="2">73.3</font></td>     <td VALIGN="top">    <p ALIGN="RIGHT"><font size="2">74.6</font></td>   </tr>   <tr>     <td VALIGN="top">    <p ALIGN="JUSTIFY"><font size="2">NO2 (m g/m<sup>3</sup>)</font></td>     <td VALIGN="top">    <p ALIGN="RIGHT"><font size="2">45.1</font></td>     <td VALIGN="top">    ]]></body>
<body><![CDATA[<p ALIGN="RIGHT"><font size="2">50.4</font></td>     <td VALIGN="top">    <p ALIGN="RIGHT"><font size="2">28.2</font></td>     <td VALIGN="top">    <p ALIGN="RIGHT"><font size="2">34.0</font></td>     <td VALIGN="top">    <p ALIGN="RIGHT"><font size="2">43.3</font></td>     <td VALIGN="top">    <p ALIGN="RIGHT"><font size="2">49.3</font></td>     <td VALIGN="top">    <p ALIGN="RIGHT"><font size="2">62.3</font></td>     <td VALIGN="top">    <p ALIGN="RIGHT"><font size="2">67.7</font></td>     <td VALIGN="top">    <p ALIGN="RIGHT"><font size="2">49.1</font></td>     <td VALIGN="top">    <p ALIGN="RIGHT"><font size="2">56.2</font></td>     <td VALIGN="top">    <p ALIGN="RIGHT"><font size="2">41.1</font></td>     <td VALIGN="top">    ]]></body>
<body><![CDATA[<p ALIGN="RIGHT"><font size="2">44.7</font></td>   </tr>   <tr>     <td VALIGN="top">    <p ALIGN="JUSTIFY"><font size="2">NO2 máximo horario (m g/m<sup>3</sup>)</font></td>     <td VALIGN="top">    <p ALIGN="RIGHT"><font size="2">77.6</font></td>     <td VALIGN="top">    <p ALIGN="RIGHT"><font size="2">83.7</font></td>     <td VALIGN="top">    <p ALIGN="RIGHT"><font size="2">52.6</font></td>     <td VALIGN="top">    <p ALIGN="RIGHT"><font size="2">58.0</font></td>     <td VALIGN="top">    <p ALIGN="RIGHT"><font size="2">75.9</font></td>     <td VALIGN="top">    <p ALIGN="RIGHT"><font size="2">79.7</font></td>     <td VALIGN="top">    <p ALIGN="RIGHT"><font size="2">105.0</font></td>     <td VALIGN="top">    <p ALIGN="RIGHT"><font size="2">111.7</font></td>     <td VALIGN="top">    ]]></body>
<body><![CDATA[<p ALIGN="RIGHT"><font size="2">84.0</font></td>     <td VALIGN="top">    <p ALIGN="RIGHT"><font size="2">92.6</font></td>     <td VALIGN="top">    <p ALIGN="RIGHT"><font size="2">71.7</font></td>     <td VALIGN="top">    <p ALIGN="RIGHT"><font size="2">75.0</font></td>   </tr>   <tr>     <td VALIGN="top">    <p ALIGN="JUSTIFY"><font size="2">CO (mg/m<sup>3</sup>)</font></td>     <td VALIGN="top">    <p ALIGN="RIGHT"><font size="2">1.9</font></td>     <td VALIGN="top">    <p ALIGN="RIGHT"><font size="2">1.5</font></td>     <td VALIGN="top">    <p ALIGN="RIGHT"><font size="2">1.0</font></td>     <td VALIGN="top">    <p ALIGN="RIGHT"><font size="2">0.8</font></td>     <td VALIGN="top">    <p ALIGN="RIGHT"><font size="2">1.7</font></td>     <td VALIGN="top">    ]]></body>
<body><![CDATA[<p ALIGN="RIGHT"><font size="2">1.3</font></td>     <td VALIGN="top">    <p ALIGN="RIGHT"><font size="2">3.1</font></td>     <td VALIGN="top">    <p ALIGN="RIGHT"><font size="2">2.6</font></td>     <td VALIGN="top">    <p ALIGN="RIGHT"><font size="2">2.2</font></td>     <td VALIGN="top">    <p ALIGN="RIGHT"><font size="2">1.9</font></td>     <td VALIGN="top">    <p ALIGN="RIGHT"><font size="2">1.6</font></td>     <td VALIGN="top">    <p ALIGN="RIGHT"><font size="2">1.2</font></td>   </tr>   <tr>     <td VALIGN="top">    <p ALIGN="JUSTIFY"><font size="2">TEMPERATURA MEDIA (ºC)</font></td>     <td VALIGN="top">    <p ALIGN="RIGHT"><font size="2">13.8</font></td>     <td VALIGN="top">    <p ALIGN="RIGHT"><font size="2">13.2</font></td>     <td VALIGN="top">    ]]></body>
<body><![CDATA[<p ALIGN="RIGHT"><font size="2">8.3</font></td>     <td VALIGN="top">    <p ALIGN="RIGHT"><font size="2">7.4</font></td>     <td VALIGN="top">    <p ALIGN="RIGHT"><font size="2">13.7</font></td>     <td VALIGN="top">    <p ALIGN="RIGHT"><font size="2">13.2</font></td>     <td VALIGN="top">    <p ALIGN="RIGHT"><font size="2">19.5</font></td>     <td VALIGN="top">    <p ALIGN="RIGHT"><font size="2">19.1</font></td>     <td VALIGN="top">    <p ALIGN="RIGHT"><font size="2">10.6</font></td>     <td VALIGN="top">    <p ALIGN="RIGHT"><font size="2">10.0</font></td>     <td VALIGN="top">    <p ALIGN="RIGHT"><font size="2">17.0</font></td>     <td VALIGN="top">    <p ALIGN="RIGHT"><font size="2">16.4</font></td>   </tr>   <tr>     <td VALIGN="top">    ]]></body>
<body><![CDATA[<p ALIGN="JUSTIFY"><font size="2">HUMEDAD RELATIVA (%)</font></td>     <td VALIGN="top">    <p ALIGN="JUSTIFY"><font size="2">79.4</font></td>     <td VALIGN="top">    <p ALIGN="JUSTIFY"><font size="2">78.0</font></td>     <td VALIGN="top">    <p ALIGN="JUSTIFY"><font size="2">67.0</font></td>     <td VALIGN="top">    <p ALIGN="JUSTIFY"><font size="2">63.0</font></td>     <td VALIGN="top">    <p ALIGN="JUSTIFY"><font size="2">81.0</font></td>     <td VALIGN="top">    <p ALIGN="JUSTIFY"><font size="2">79.0</font></td>     <td VALIGN="top">    <p ALIGN="JUSTIFY"><font size="2">90.0</font></td>     <td VALIGN="top">    <p ALIGN="JUSTIFY"><font size="2">92.0</font></td>     <td VALIGN="top">    <p ALIGN="JUSTIFY"><font size="2">78.6</font></td>     <td VALIGN="top">    ]]></body>
<body><![CDATA[<p ALIGN="JUSTIFY"><font size="2">76.3</font></td>     <td VALIGN="top">    <p ALIGN="JUSTIFY"><font size="2">80.3</font></td>     <td VALIGN="top">    <p ALIGN="JUSTIFY"><font size="2">79.6</font></td>   </tr>   <tr>     <td VALIGN="top">    <p ALIGN="JUSTIFY"><font size="2">GRIPE (n)</font></td>     <td VALIGN="top">    <p ALIGN="JUSTIFY"><font size="2">59.4</font></td>     <td VALIGN="top">    <p ALIGN="JUSTIFY"><font size="2">39.1</font></td>     <td VALIGN="top">    <p ALIGN="JUSTIFY"><font size="2">8.1</font></td>     <td VALIGN="top">    <p ALIGN="JUSTIFY"><font size="2">6.1</font></td>     <td VALIGN="top">    <p ALIGN="JUSTIFY"><font size="2">42.4</font></td>     <td VALIGN="top">    <p ALIGN="JUSTIFY"><font size="2">26.7</font></td>     <td VALIGN="top">    ]]></body>
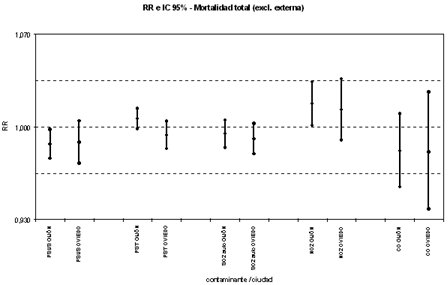
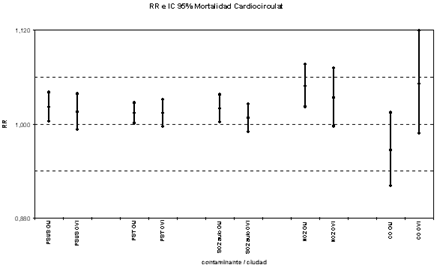
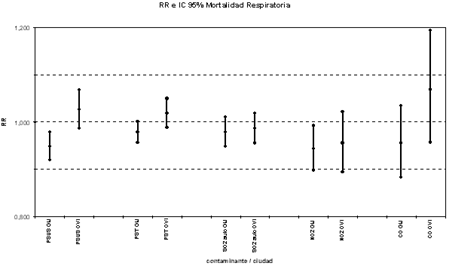
<body><![CDATA[<p ALIGN="JUSTIFY"><font size="2">131.1</font></td>     <td VALIGN="top">    <p ALIGN="JUSTIFY"><font size="2">81.1</font></td>     <td VALIGN="top">    <p ALIGN="JUSTIFY"><font size="2">95.1</font></td>     <td VALIGN="top">    <p ALIGN="JUSTIFY"><font size="2">61.3</font></td>     <td VALIGN="top">    <p ALIGN="JUSTIFY"><font size="2">24.3</font></td>     <td VALIGN="top">    <p ALIGN="JUSTIFY"><font size="2">17.3</font></td>   </tr>   <tr>     <td VALIGN="top" colspan="13">    <p ALIGN="JUSTIFY"><font size="2">* Semestre Frío:     Noviembre-Abril. Semestre Cálido: Mayo-Octubre</font></td>   </tr> </table> </center></div>      <p ALIGN="JUSTIFY">&nbsp;</p>      <p ALIGN="JUSTIFY"><font size="3">Las estimaciones del riesgo relativo de cada contaminante respecto a cada causa de mortalidad, obtenidas tras el análisis mediante regresión de Poisson, se presentan en las <a href="#tab4">tablas 4</a> y <a href="#tab5">5</a> y en la <a href="#fig3">figura 3</a>. Para la mortalidad total se encuentra una asociación positiva y estadísticamente significativa en el NO<sub>2</sub> en Gijón, mientras que en Oviedo, aunque la estimación puntual del riesgo relativo es positiva, el intervalo de confianza engloba la unidad. Se detectan asociaciones negativas estadísticamente significativas para las partículas en Gijón y para el SO<sub>2</sub> en Oviedo (aunque la significación estadística es inconsistente cuando comparamos las 2 técnicas de determinación, manual y automática). Por último, para la mortalidad cardiocirculatoria la mayoría de las asociaciones encontradas son positivas y, en el caso de Gijón, estadísticamente significativas, especialmente con el NO<sub>2</sub>.</font></p> <b>      <p ALIGN="CENTER"></b><a name="tab4"></a>&nbsp;&nbsp; </p>      ]]></body>
<body><![CDATA[<p ALIGN="CENTER"><font size="3"><b>Tabla 4    <br> Estimaciones de la asociación entre contaminantes y mortalidad en Gijón: riesgo relativo para cada 10 m g/m<sup>3</sup> (1 mg/m<sup>3</sup> para CO) e intervalos de confianza.    <br> Se especifica el retardo (ret*) de contaminante con asociación más significativa.</b></font></p>     <div align="center">    <center>  <table BORDER="0" CELLSPACING="1" bgcolor="#ECECEC">   <tr>     <td VALIGN="top" align="center" bgcolor="#C0C0C0">    <p ALIGN="JUSTIFY"><font size="3"><strong>GIJÓN</strong></font></td>     <td VALIGN="top" COLSPAN="3" align="center" bgcolor="#C0C0C0">    <p ALIGN="JUSTIFY"><font     size="3">MORT. TOTAL (excl. externa)</font></td>     <td VALIGN="top" COLSPAN="3" align="center" bgcolor="#C0C0C0">    <p ALIGN="JUSTIFY"><font     size="3">MORT. 70+ (total excl. externa)</font></td>     <td VALIGN="top" COLSPAN="3" align="center" bgcolor="#C0C0C0">    <p ALIGN="JUSTIFY"><font     size="3">MORT. CARDIOCIRCULATORIA</font></td>     <td VALIGN="top" COLSPAN="3" align="center" bgcolor="#C0C0C0">    <p ALIGN="JUSTIFY"><font     size="3">MORT. RESPIRATORIA</font></td>   </tr>   <tr>     <td VALIGN="top" align="center" bgcolor="#C0C0C0">&nbsp;&nbsp; </td>     <td VALIGN="top" align="center" bgcolor="#C0C0C0">    ]]></body>
<body><![CDATA[<p ALIGN="JUSTIFY"><font size="3">ret*</font></td>     <td VALIGN="top" align="center" bgcolor="#C0C0C0">    <p ALIGN="JUSTIFY"><font size="3">RR</font></td>     <td VALIGN="top" align="center" bgcolor="#C0C0C0">    <p ALIGN="JUSTIFY"><font size="3">IC<sub>RR</sub>     95%</font></td>     <td VALIGN="top" align="center" bgcolor="#C0C0C0">    <p ALIGN="JUSTIFY"><font size="3">ret*</font></td>     <td VALIGN="top" align="center" bgcolor="#C0C0C0">    <p ALIGN="JUSTIFY"><font size="3">RR</font></td>     <td VALIGN="top" align="center" bgcolor="#C0C0C0">    <p ALIGN="JUSTIFY"><font size="3">IC<sub>RR</sub>     95%</font></td>     <td VALIGN="top" align="center" bgcolor="#C0C0C0">    <p ALIGN="JUSTIFY"><font size="3">ret*</font></td>     <td VALIGN="top" align="center" bgcolor="#C0C0C0">    <p ALIGN="JUSTIFY"><font size="3">RR</font></td>     <td VALIGN="top" align="center" bgcolor="#C0C0C0">    <p ALIGN="JUSTIFY"><font size="3">IC<sub>RR</sub>     95%</font></td>     <td VALIGN="top" align="center" bgcolor="#C0C0C0">    <p ALIGN="JUSTIFY"><font size="3">ret*</font></td>     <td VALIGN="top" align="center" bgcolor="#C0C0C0">    ]]></body>
<body><![CDATA[<p ALIGN="JUSTIFY"><font size="3">RR</font></td>     <td VALIGN="top" align="center" bgcolor="#C0C0C0">    <p ALIGN="JUSTIFY"><font size="3">IC<sub>RR</sub>     95%</font></td>   </tr>   <tr>     <td VALIGN="top" align="center">    <p ALIGN="JUSTIFY"><font size="3">PSUS</font></td>     <td VALIGN="top" align="center">    <p ALIGN="RIGHT"><font size="3">4</font></td>     <td VALIGN="top" align="center">    <p ALIGN="RIGHT"><font size="3">0,9869</font></td>     <td VALIGN="top" align="center">    <p ALIGN="RIGHT"><font size="3">0,9761 - 0,9979</font></td>     <td VALIGN="top" align="center">    <p ALIGN="RIGHT"><font size="3">4</font></td>     <td VALIGN="top" align="center">    <p ALIGN="RIGHT"><font size="3">0,9848</font></td>     <td VALIGN="top" align="center">    <p ALIGN="RIGHT"><font size="3">0,9722 - 0,9974</font></td>     <td VALIGN="top" align="center">    <p ALIGN="RIGHT"><font size="3">5</font></td>     <td VALIGN="top" align="center">    ]]></body>
<body><![CDATA[<p ALIGN="RIGHT"><font size="3">1,0214</font></td>     <td VALIGN="top" align="center">    <p ALIGN="CENTER"><font size="3">1,0031 - 1,0401</font></td>     <td VALIGN="top" align="center">    <p ALIGN="RIGHT"><font size="3">4</font></td>     <td VALIGN="top" align="center">    <p ALIGN="RIGHT"><font size="3">0,9488</font></td>     <td VALIGN="top" align="center">    <p ALIGN="RIGHT"><font size="3">0,9197 - 0,9789</font></td>   </tr>   <tr>     <td VALIGN="top" align="center">    <p ALIGN="JUSTIFY"><font size="3">SO2 manual</font></td>     <td VALIGN="top" align="center">    <p ALIGN="RIGHT"><font size="3">5</font></td>     <td VALIGN="top" align="center">    <p ALIGN="RIGHT"><font size="3">1,0120</font></td>     <td VALIGN="top" align="center">    <p ALIGN="RIGHT"><font size="3">0,9957 - 1,0285</font></td>     <td VALIGN="top" align="center">    <p ALIGN="right"><font size="3">5</font></td>     <td VALIGN="top" align="center">    ]]></body>
<body><![CDATA[<p ALIGN="RIGHT"><font size="3">1,0091</font></td>     <td VALIGN="top" align="center">    <p ALIGN="RIGHT"><font size="3">0,9902 - 1,0283</font></td>     <td VALIGN="top" align="center">    <p ALIGN="RIGHT"><font size="3">5</font></td>     <td VALIGN="top" align="center">    <p ALIGN="RIGHT"><font size="3">1,0227</font></td>     <td VALIGN="top" align="center">    <p ALIGN="CENTER"><font size="3">0,9966 - 1,0495</font></td>     <td VALIGN="top" align="center">    <p ALIGN="RIGHT"><font size="3">4</font></td>     <td VALIGN="top" align="center">    <p ALIGN="RIGHT"><font size="3">0,9751</font></td>     <td VALIGN="top" align="center">    <p ALIGN="RIGHT"><font size="3">0,9332 - 1,0188</font></td>   </tr>   <tr>     <td VALIGN="top" align="center">    <p ALIGN="JUSTIFY"><font size="3">SO2 auto</font></td>     <td VALIGN="top" align="center">    <p ALIGN="RIGHT"><font size="3">0</font></td>     <td VALIGN="top" align="center">    ]]></body>
<body><![CDATA[<p ALIGN="RIGHT"><font size="3">0,9946</font></td>     <td VALIGN="top" align="center">    <p ALIGN="RIGHT"><font size="3">0,9843 -1,0051</font></td>     <td VALIGN="top" align="center">    <p ALIGN="RIGHT"><font size="3">0</font></td>     <td VALIGN="top" align="center">    <p ALIGN="RIGHT"><font size="3">0,9896</font></td>     <td VALIGN="top" align="center">    <p ALIGN="RIGHT"><font size="3">0,9778 - 1,0015</font></td>     <td VALIGN="top" align="center">    <p ALIGN="RIGHT"><font size="3">5</font></td>     <td VALIGN="top" align="center">    <p ALIGN="RIGHT"><font size="3">1,0197</font></td>     <td VALIGN="top" align="center">    <p ALIGN="CENTER"><font size="3">1,0024 - 1,0372</font></td>     <td VALIGN="top" align="center">    <p ALIGN="RIGHT"><font size="3">2</font></td>     <td VALIGN="top" align="center">    <p ALIGN="RIGHT"><font size="3">0,9791</font></td>     <td VALIGN="top" align="center">    ]]></body>
<body><![CDATA[<p ALIGN="RIGHT"><font size="3">0,9486 - 1,0104</font></td>   </tr>   <tr>     <td VALIGN="top" align="center">    <p ALIGN="JUSTIFY"><font size="3">SO2 máx</font></td>     <td VALIGN="top" align="center">    <p ALIGN="RIGHT"><font size="3">5</font></td>     <td VALIGN="top" align="center">    <p ALIGN="RIGHT"><font size="3">1,0031</font></td>     <td VALIGN="top" align="center">    <p ALIGN="RIGHT"><font size="3">0,9993 - 1,0070</font></td>     <td VALIGN="top" align="center">    <p ALIGN="RIGHT"><font size="3">0</font></td>     <td VALIGN="top" align="center">    <p ALIGN="RIGHT"><font size="3">0,9957</font></td>     <td VALIGN="top" align="center">    <p ALIGN="RIGHT"><font size="3">0,9912 - 1,0001</font></td>     <td VALIGN="top" align="center">    <p ALIGN="RIGHT"><font size="3">5</font></td>     <td VALIGN="top" align="center">    <p ALIGN="RIGHT"><font size="3">1,0072</font></td>     <td VALIGN="top" align="center">    ]]></body>
<body><![CDATA[<p ALIGN="CENTER"><font size="3">1,0008 - 1,0136</font></td>     <td VALIGN="top" align="center">    <p ALIGN="RIGHT"><font size="3">2</font></td>     <td VALIGN="top" align="center">    <p ALIGN="RIGHT"><font size="3">0,9940</font></td>     <td VALIGN="top" align="center">    <p ALIGN="RIGHT"><font size="3">0,9821 - 1,0061</font></td>   </tr>   <tr>     <td VALIGN="top" align="center">    <p ALIGN="JUSTIFY"><font size="3">PST</font></td>     <td VALIGN="top" align="center">    <p ALIGN="RIGHT"><font size="3">0</font></td>     <td VALIGN="top" align="center">    <p ALIGN="RIGHT"><font size="3">1,0060</font></td>     <td VALIGN="top" align="center">    <p ALIGN="RIGHT"><font size="3">0,9985 - 1,0136</font></td>     <td VALIGN="top" align="center">    <p ALIGN="RIGHT"><font size="3">0</font></td>     <td VALIGN="top" align="center">    <p ALIGN="RIGHT"><font size="3">1,0062</font></td>     <td VALIGN="top" align="center">    ]]></body>
<body><![CDATA[<p ALIGN="RIGHT"><font size="3">0,9975 - 1,0150</font></td>     <td VALIGN="top" align="center">    <p ALIGN="RIGHT"><font size="3">5</font></td>     <td VALIGN="top" align="center">    <p ALIGN="RIGHT"><font size="3">1,0137</font></td>     <td VALIGN="top" align="center">    <p ALIGN="CENTER"><font size="3">1,0010 - 1,0267</font></td>     <td VALIGN="top" align="center">    <p ALIGN="RIGHT"><font size="3">2</font></td>     <td VALIGN="top" align="center">    <p ALIGN="RIGHT"><font size="3">0,9784</font></td>     <td VALIGN="top" align="center">    <p ALIGN="RIGHT"><font size="3">0,9568 - 1,0005</font></td>   </tr>   <tr>     <td VALIGN="top" align="center">    <p ALIGN="JUSTIFY"><font size="3">NO2</font></td>     <td VALIGN="top" align="center">    <p ALIGN="RIGHT"><font size="3">5</font></td>     <td VALIGN="top" align="center">    <p ALIGN="RIGHT"><font size="3">1,0173</font></td>     <td VALIGN="top" align="center">    ]]></body>
<body><![CDATA[<p ALIGN="RIGHT"><font size="3">1,0011 - 1,0338</font></td>     <td VALIGN="top" align="center">    <p ALIGN="RIGHT"><font size="3">5</font></td>     <td VALIGN="top" align="center">    <p ALIGN="RIGHT"><font size="3">1,0164</font></td>     <td VALIGN="top" align="center">    <p ALIGN="RIGHT"><font size="3">0,9975 - 1,0358</font></td>     <td VALIGN="top" align="center">    <p ALIGN="RIGHT"><font size="3">5</font></td>     <td VALIGN="top" align="center">    <p ALIGN="RIGHT"><font size="3">1,0486</font></td>     <td VALIGN="top" align="center">    <p ALIGN="CENTER"><font size="3">1,0220 - 1,0758</font></td>     <td VALIGN="top" align="center">    <p ALIGN="RIGHT"><font size="3">2</font></td>     <td VALIGN="top" align="center">    <p ALIGN="RIGHT"><font size="3">0,9437</font></td>     <td VALIGN="top" align="center">    <p ALIGN="RIGHT"><font size="3">0,8979 - 0,9919</font></td>   </tr>   <tr>     <td VALIGN="top" align="center">    ]]></body>
<body><![CDATA[<p ALIGN="JUSTIFY"><font size="3">NO2 máx</font></td>     <td VALIGN="top" align="center">    <p ALIGN="RIGHT"><font size="3">1</font></td>     <td VALIGN="top" align="center">    <p ALIGN="RIGHT"><font size="3">1,0079</font></td>     <td VALIGN="top" align="center">    <p ALIGN="RIGHT"><font size="3">0,9976 - 1,0183</font></td>     <td VALIGN="top" align="center">    <p ALIGN="RIGHT"><font size="3">1</font></td>     <td VALIGN="top" align="center">    <p ALIGN="RIGHT"><font size="3">1,0047</font></td>     <td VALIGN="top" align="center">    <p ALIGN="RIGHT"><font size="3">0,9927 - 1,0168</font></td>     <td VALIGN="top" align="center">    <p ALIGN="RIGHT"><font size="3">4</font></td>     <td VALIGN="top" align="center">    <p ALIGN="RIGHT"><font size="3">1,0215</font></td>     <td VALIGN="top" align="center">    <p ALIGN="CENTER"><font size="3">1,0039 - 1,0395</font></td>     <td VALIGN="top" align="center">    ]]></body>
<body><![CDATA[<p ALIGN="RIGHT"><font size="3">2</font></td>     <td VALIGN="top" align="center">    <p ALIGN="RIGHT"><font size="3">0,9747</font></td>     <td VALIGN="top" align="center">    <p ALIGN="RIGHT"><font size="3">0,9451 - 1,0051</font></td>   </tr>   <tr>     <td VALIGN="top" align="center">    <p ALIGN="JUSTIFY"><font size="3">CO</font></td>     <td VALIGN="top" align="center">    <p ALIGN="RIGHT"><font size="3">1</font></td>     <td VALIGN="top" align="center">    <p ALIGN="RIGHT"><font size="3">0,9819</font></td>     <td VALIGN="top" align="center">    <p ALIGN="RIGHT"><font size="3">0,9547 - 1,0098</font></td>     <td VALIGN="top" align="center">    <p ALIGN="RIGHT"><font size="3">1</font></td>     <td VALIGN="top" align="center">    <p ALIGN="RIGHT"><font size="3">0,9758</font></td>     <td VALIGN="top" align="center">    <p ALIGN="RIGHT"><font size="3">0,9444 - 1,0083</font></td>     <td VALIGN="top" align="center">    ]]></body>
<body><![CDATA[<p ALIGN="RIGHT"><font size="3">1</font></td>     <td VALIGN="top" align="center">    <p ALIGN="RIGHT"><font size="3">0,9666</font></td>     <td VALIGN="top" align="center">    <p ALIGN="CENTER"><font size="3">0,9211 - 1,0143</font></td>     <td VALIGN="top" align="center">    <p ALIGN="RIGHT"><font size="3">5</font></td>     <td VALIGN="top" align="center">    <p ALIGN="RIGHT"><font size="3">0,9556</font></td>     <td VALIGN="top" align="center">    <p ALIGN="RIGHT"><font size="3">0,8830 - 1,0341</font></td>   </tr> </table> </center></div>      <p ALIGN="JUSTIFY"><a name="tab5"></a>&nbsp;&nbsp; </p>      <p ALIGN="CENTER"><font size="3"><b>Tabla 5    <br> Estimaciones de la asociación entre contaminantes y mortalidad en Oviedo: riesgo relativo para cada 10 m g/m<sup>3</sup> (1 mg/m<sup>3</sup> para CO) e intervalos de confianza.    <br> Se especifica el retardo (ret*) de contaminante con asociación más significativa.</b></font></p>     ]]></body>
<body><![CDATA[<div align="center">    <center>  <table BORDER="0" CELLSPACING="1" bgcolor="#ECECEC">   <tr>     <td VALIGN="top" bgcolor="#C0C0C0">    <p ALIGN="JUSTIFY"><font size="3"><strong>OVIEDO</strong></font></td>     <td VALIGN="top" COLSPAN="3" bgcolor="#C0C0C0">    <p ALIGN="JUSTIFY"><font size="3">MORT.     TOTAL (excl. externa)</font></td>     <td VALIGN="top" COLSPAN="3" bgcolor="#C0C0C0">    <p ALIGN="JUSTIFY"><font size="3">MORT. 70+     (total excl. externa)</font></td>     <td VALIGN="top" COLSPAN="3" bgcolor="#C0C0C0">    <p ALIGN="JUSTIFY"><font size="3">MORT.     CARDIOCIRCULATORIA</font></td>     <td VALIGN="top" COLSPAN="3" bgcolor="#C0C0C0">    <p ALIGN="JUSTIFY"><font size="3">MORT.     RESPIRATORIA</font></td>   </tr>   <tr>     <td VALIGN="top" bgcolor="#C0C0C0">&nbsp;&nbsp; </td>     <td VALIGN="top" bgcolor="#C0C0C0">    <p ALIGN="JUSTIFY"><font size="3">ret*</font></td>     <td VALIGN="top" bgcolor="#C0C0C0">    <p ALIGN="JUSTIFY"><font size="3">RR</font></td>     <td VALIGN="top" bgcolor="#C0C0C0">    <p ALIGN="JUSTIFY"><font size="3">IC<sub>RR</sub> 95%</font></td>     <td VALIGN="top" bgcolor="#C0C0C0">    ]]></body>
<body><![CDATA[<p ALIGN="JUSTIFY"><font size="3">ret*</font></td>     <td VALIGN="top" bgcolor="#C0C0C0">    <p ALIGN="JUSTIFY"><font size="3">RR</font></td>     <td VALIGN="top" bgcolor="#C0C0C0">    <p ALIGN="JUSTIFY"><font size="3">IC<sub>RR</sub> 95%</font></td>     <td VALIGN="top" bgcolor="#C0C0C0">    <p ALIGN="JUSTIFY"><font size="3">ret*</font></td>     <td VALIGN="top" bgcolor="#C0C0C0">    <p ALIGN="JUSTIFY"><font size="3">RR</font></td>     <td VALIGN="top" bgcolor="#C0C0C0">    <p ALIGN="JUSTIFY"><font size="3">IC<sub>RR</sub> 95%</font></td>     <td VALIGN="top" bgcolor="#C0C0C0">    <p ALIGN="JUSTIFY"><font size="3">ret*</font></td>     <td VALIGN="top" bgcolor="#C0C0C0">    <p ALIGN="JUSTIFY"><font size="3">RR</font></td>     <td VALIGN="top" bgcolor="#C0C0C0">    <p ALIGN="JUSTIFY"><font size="3">IC<sub>RR</sub> 95%</font></td>   </tr>   <tr>     <td VALIGN="top">    <p ALIGN="JUSTIFY"><font size="3">PSUS</font></td>     <td VALIGN="top">    ]]></body>
<body><![CDATA[<p ALIGN="RIGHT"><font size="3">5</font></td>     <td VALIGN="top">    <p ALIGN="RIGHT"><font size="3">0,9883</font></td>     <td VALIGN="top">    <p ALIGN="RIGHT"><font size="3">0,9725 - 1,0044</font></td>     <td VALIGN="top">    <p ALIGN="RIGHT"><font size="3">5</font></td>     <td VALIGN="top">    <p ALIGN="RIGHT"><font size="3">0,9803</font></td>     <td VALIGN="top">    <p ALIGN="CENTER"><font size="3">0,9609 - 1,0001</font></td>     <td VALIGN="top">    <p ALIGN="RIGHT"><font size="3">2</font></td>     <td VALIGN="top">    <p ALIGN="RIGHT"><font size="3">1,0153</font></td>     <td VALIGN="top">    <p ALIGN="CENTER"><font size="3">0,9926 - 1,0384</font></td>     <td VALIGN="top">    <p ALIGN="RIGHT"><font size="3">1</font></td>     <td VALIGN="top">    ]]></body>
<body><![CDATA[<p ALIGN="RIGHT"><font size="3">1,0262</font></td>     <td VALIGN="top">    <p ALIGN="CENTER"><font size="3">0,9864 - 1,0677</font></td>   </tr>   <tr>     <td VALIGN="top">    <p ALIGN="JUSTIFY"><font size="3">SO2 manual</font></td>     <td VALIGN="top">    <p ALIGN="RIGHT"><font size="3">2</font></td>     <td VALIGN="top">    <p ALIGN="RIGHT"><font size="3">0,9711</font></td>     <td VALIGN="top">    <p ALIGN="RIGHT"><font size="3">0,9499 - 0,9929</font></td>     <td VALIGN="top">    <p ALIGN="RIGHT"><font size="3">2</font></td>     <td VALIGN="top">    <p ALIGN="RIGHT"><font size="3">0,9717</font></td>     <td VALIGN="top">    <p ALIGN="CENTER"><font size="3">0,9441 - 1,0001</font></td>     <td VALIGN="top">    <p ALIGN="RIGHT"><font size="3">5</font></td>     <td VALIGN="top">    ]]></body>
<body><![CDATA[<p ALIGN="RIGHT"><font size="3">0,9862</font></td>     <td VALIGN="top">    <p ALIGN="CENTER"><font size="3">0,9533 - 1,0202</font></td>     <td VALIGN="top">    <p ALIGN="RIGHT"><font size="3">1</font></td>     <td VALIGN="top">    <p ALIGN="RIGHT"><font size="3">1,0538</font></td>     <td VALIGN="top">    <p ALIGN="CENTER"><font size="3">0,9952 - 1,1159</font></td>   </tr>   <tr>     <td VALIGN="top">    <p ALIGN="JUSTIFY"><font size="3">SO2 auto</font></td>     <td VALIGN="top">    <p ALIGN="RIGHT"><font size="3">5</font></td>     <td VALIGN="top">    <p ALIGN="RIGHT"><font size="3">0,9909</font></td>     <td VALIGN="top">    <p ALIGN="RIGHT"><font size="3">0,9795 - 1,0025</font></td>     <td VALIGN="top">    <p ALIGN="RIGHT"><font size="3">5</font></td>     <td VALIGN="top">    ]]></body>
<body><![CDATA[<p ALIGN="RIGHT"><font size="3">0,9813</font></td>     <td VALIGN="top">    <p ALIGN="CENTER"><font size="3">0,9679 - 0,9949</font></td>     <td VALIGN="top">    <p ALIGN="RIGHT"><font size="3">4</font></td>     <td VALIGN="top">    <p ALIGN="RIGHT"><font size="3">1,0077</font></td>     <td VALIGN="top">    <p ALIGN="CENTER"><font size="3">0,9900 - 1,0256</font></td>     <td VALIGN="top">    <p ALIGN="RIGHT"><font size="3">5</font></td>     <td VALIGN="top">    <p ALIGN="RIGHT"><font size="3">0,9866</font></td>     <td VALIGN="top">    <p ALIGN="CENTER"><font size="3">0,9554 - 1,0188</font></td>   </tr>   <tr>     <td VALIGN="top">    <p ALIGN="JUSTIFY"><font size="3">SO2 máx</font></td>     <td VALIGN="top">    <p ALIGN="RIGHT"><font size="3">2</font></td>     <td VALIGN="top">    ]]></body>
<body><![CDATA[<p ALIGN="RIGHT"><font size="3">0,9965</font></td>     <td VALIGN="top">    <p ALIGN="RIGHT"><font size="3">0,9920 - 1,0010</font></td>     <td VALIGN="top">    <p ALIGN="RIGHT"><font size="3">5</font></td>     <td VALIGN="top">    <p ALIGN="RIGHT"><font size="3">0,9946</font></td>     <td VALIGN="top">    <p ALIGN="CENTER"><font size="3">0,9895 - 0,9998</font></td>     <td VALIGN="top">    <p ALIGN="RIGHT"><font size="3">2</font></td>     <td VALIGN="top">    <p ALIGN="RIGHT"><font size="3">0,9959</font></td>     <td VALIGN="top">    <p ALIGN="CENTER"><font size="3">0,9889 - 1,0030</font></td>     <td VALIGN="top">    <p ALIGN="RIGHT"><font size="3">3</font></td>     <td VALIGN="top">    <p ALIGN="RIGHT"><font size="3">1,0051</font></td>     <td VALIGN="top">    ]]></body>
<body><![CDATA[<p ALIGN="CENTER"><font size="3">0,9924 - 1,0180</font></td>   </tr>   <tr>     <td VALIGN="top">    <p ALIGN="JUSTIFY"><font size="3">PST</font></td>     <td VALIGN="top">    <p ALIGN="RIGHT"><font size="3">0</font></td>     <td VALIGN="top">    <p ALIGN="RIGHT"><font size="3">0,9937</font></td>     <td VALIGN="top">    <p ALIGN="RIGHT"><font size="3">0,9835 - 1,0041</font></td>     <td VALIGN="top">    <p ALIGN="RIGHT"><font size="3">5</font></td>     <td VALIGN="top">    <p ALIGN="RIGHT"><font size="3">0,9896</font></td>     <td VALIGN="top">    <p ALIGN="CENTER"><font size="3">0,9771 - 1,0022</font></td>     <td VALIGN="top">    <p ALIGN="RIGHT"><font size="3">2</font></td>     <td VALIGN="top">    <p ALIGN="RIGHT"><font size="3">1,0136</font></td>     <td VALIGN="top">    ]]></body>
<body><![CDATA[<p ALIGN="CENTER"><font size="3">0,9965 - 1,0309</font></td>     <td VALIGN="top">    <p ALIGN="RIGHT"><font size="3">2</font></td>     <td VALIGN="top">    <p ALIGN="RIGHT"><font size="3">1,0181</font></td>     <td VALIGN="top">    <p ALIGN="CENTER"><font size="3">0,9879 - 1,0493</font></td>   </tr>   <tr>     <td VALIGN="top">    <p ALIGN="JUSTIFY"><font size="3">NO2</font></td>     <td VALIGN="top">    <p ALIGN="RIGHT"><font size="3">1</font></td>     <td VALIGN="top">    <p ALIGN="RIGHT"><font size="3">1,0128</font></td>     <td VALIGN="top">    <p ALIGN="RIGHT"><font size="3">0,9900 - 1,0361</font></td>     <td VALIGN="top">    <p ALIGN="RIGHT"><font size="3">5</font></td>     <td VALIGN="top">    <p ALIGN="RIGHT"><font size="3">0,9838</font></td>     <td VALIGN="top">    ]]></body>
<body><![CDATA[<p ALIGN="CENTER"><font size="3">0,9574 - 1,0110</font></td>     <td VALIGN="top">    <p ALIGN="RIGHT"><font size="3">3</font></td>     <td VALIGN="top">    <p ALIGN="RIGHT"><font size="3">1,0335</font></td>     <td VALIGN="top">    <p ALIGN="CENTER"><font size="3">0,9971 - 1,0713</font></td>     <td VALIGN="top">    <p ALIGN="RIGHT"><font size="3">5</font></td>     <td VALIGN="top">    <p ALIGN="RIGHT"><font size="3">0,9557</font></td>     <td VALIGN="top">    <p ALIGN="CENTER"><font size="3">0,8939 - 1,0218</font></td>   </tr>   <tr>     <td VALIGN="top">    <p ALIGN="JUSTIFY"><font size="3">NO2 máx</font></td>     <td VALIGN="top">    <p ALIGN="RIGHT"><font size="3">3</font></td>     <td VALIGN="top">    <p ALIGN="RIGHT"><font size="3">1,0039</font></td>     <td VALIGN="top">    ]]></body>
<body><![CDATA[<p ALIGN="RIGHT"><font size="3">0,9916 - 1,0163</font></td>     <td VALIGN="top">    <p ALIGN="RIGHT"><font size="3">5</font></td>     <td VALIGN="top">    <p ALIGN="RIGHT"><font size="3">0,9898</font></td>     <td VALIGN="top">    <p ALIGN="CENTER"><font size="3">0,9756 - 1,0042</font></td>     <td VALIGN="top">    <p ALIGN="RIGHT"><font size="3">2</font></td>     <td VALIGN="top">    <p ALIGN="RIGHT"><font size="3">1,0165</font></td>     <td VALIGN="top">    <p ALIGN="CENTER"><font size="3">0,9976 - 1,0357</font></td>     <td VALIGN="top">    <p ALIGN="RIGHT"><font size="3">2</font></td>     <td VALIGN="top">    <p ALIGN="RIGHT"><font size="3">1,0302</font></td>     <td VALIGN="top">    <p ALIGN="CENTER"><font size="3">0,9963 - 1,0654</font></td>   </tr>   <tr>     <td VALIGN="top">    ]]></body>
<body><![CDATA[<p ALIGN="JUSTIFY"><font size="3">CO</font></td>     <td VALIGN="top">    <p ALIGN="RIGHT"><font size="3">5</font></td>     <td VALIGN="top">    <p ALIGN="RIGHT"><font size="3">0,9810</font></td>     <td VALIGN="top">    <p ALIGN="RIGHT"><font size="3">0,9378 - 1,0262</font></td>     <td VALIGN="top">    <p ALIGN="RIGHT"><font size="3">5</font></td>     <td VALIGN="top">    <p ALIGN="RIGHT"><font size="3">0,9598</font></td>     <td VALIGN="top">    <p ALIGN="CENTER"><font size="3">0,9094 - 1,0129</font></td>     <td VALIGN="top">    <p ALIGN="RIGHT"><font size="3">3</font></td>     <td VALIGN="top">    <p ALIGN="RIGHT"><font size="3">1,0513</font></td>     <td VALIGN="top">    <p ALIGN="CENTER"><font size="3">0,9880 - 1,1187</font></td>     <td VALIGN="top">    ]]></body>
<body><![CDATA[<p ALIGN="RIGHT"><font size="3">2</font></td>     <td VALIGN="top">    <p ALIGN="RIGHT"><font size="3">1,0687</font></td>     <td VALIGN="top">    <p ALIGN="CENTER"><font size="3">0,9572 - 1,1932</font></td>   </tr> </table> </center></div><b>      <p>&nbsp;</p>      <p>&nbsp;</p>      <p ALIGN="CENTER"><font size="4">DISCUSIÓN</font></b></p>      <p ALIGN="JUSTIFY"><font size="3">Los niveles de contaminación encontrados en Oviedo y Gijón pueden considerarse globalmente bajos y, ocasionalmente, medios. En Gijón, en el período a estudio, los niveles de partículas en suspensión y de CO son mayores que en Oviedo. Por contra Oviedo presenta niveles superiores de NO<sub>2</sub> y SO<sub>2</sub>. Estas diferencias pueden explicarse, en parte, por la ubicación geográfica de ambas ciudades: Gijón en la costa (facilitando el viento la dispersión de contaminantes), Oviedo en el interior y próxima a una cadena montañosa (más afectada por las situaciones de inversión térmica). También influirían los diversos orígenes de la contaminación: en Oviedo fundamentalmente urbana (tráfico y calefacciones), en Gijón mixta (urbana-industrial). Las mediciones automáticas de SO<sub>2</sub> dan valores superiores que las manuales, especialmente en Oviedo. Una posible explicación a este hecho estaría en el diferente número y ubicación de las estaciones pero, incluso en aquéllas que están muy próximas, las correlaciones son sólo moderadas y los niveles son mayores en la medición automática. Aunque en caso de discrepancia suelen considerarse más fiables las determinaciones de las estaciones automáticas, los niveles establecidos por la legislación para el SO<sub>2</sub> están basados en técnicas manuales.</font></p>      <p ALIGN="JUSTIFY"><font size="3">En el análisis simple de Poisson, incluyendo sólo una variable de contaminación y una de mortalidad, todos los contaminantes presentan asociación positiva significativa (&lt;0,10) para la mortalidad total en ambas ciudades, excepto el SO<sub>2 </sub>máx en Gijón y las PST en Oviedo.</font></p>      <p ALIGN="JUSTIFY"><font size="3">Los modelos basales definitivos ajustados para la mortalidad total con el objeto de tener en cuenta el efecto de las variables de control, incluyeron, tanto en Gijón como en Oviedo, términos sinusoidales, gripe y temperatura (las variables originales o alguno de sus retardos o funciones cuadráticas), junto con las variables correspondientes a días de la semana, que se incluían en todos los casos siguiendo el protocolo. Además en Gijón se mantuvieron en este modelo final la humedad relativa y la tendencia (<a href="#tab3">tabla 3</a>). </font></p>      <p ALIGN="JUSTIFY"><a name="tab3"></a>&nbsp;&nbsp;&nbsp; </p>      ]]></body>
<body><![CDATA[<p ALIGN="CENTER"><font size="3"><strong>Tabla 3.    <br> Variables incluidas en los modelos basales para cada tipo de mortalidad, en ambas ciudades.</strong></font></p>     <div align="center">    <center>  <table BORDER="0" CELLSPACING="1" bgcolor="#ECECEC">   <tr>     <td VALIGN="top" bgcolor="#C0C0C0">    <p ALIGN="JUSTIFY"><font size="3">MORTALIDAD</font></td>     <td VALIGN="top" bgcolor="#C0C0C0"><b>    <p ALIGN="JUSTIFY"><font size="3">GIJÓN</font></b></td>     <td VALIGN="top" bgcolor="#C0C0C0"><b>    <p ALIGN="JUSTIFY"><font size="3">OVIEDO</font></b></td>   </tr>   <tr>     <td VALIGN="top">    <p ALIGN="JUSTIFY"><font size="3">TOTAL (excl. externa)</font></td>     <td VALIGN="top">    <p ALIGN="JUSTIFY"><font size="3">sen/cos de 1º y 6º orden retardos 3º     y 6º de la T<sup>2</sup> humedad relativa y hum<sup>2</sup> tendencia y tend<sup>2</sup>     retardo 4º de la gripe</font></td>     <td VALIGN="top">    <p ALIGN="JUSTIFY"><font size="3">sen/cos de 1º y 5º orden retardo 5º     de la temperatura retardo 2º de la T<sup>2</sup> retardos 3º y 5º de la gripe</font></td>   </tr>   <tr>     <td VALIGN="top">    ]]></body>
<body><![CDATA[<p ALIGN="JUSTIFY"><font size="3">TOTAL 70+ AÑOS (excl. externa)</font></td>     <td VALIGN="top">    <p ALIGN="JUSTIFY"><font size="3">sen/cos de 1º y 6º orden T<sup>2</sup>     y su 6º retardo retardo 6º de la humedad relativa y hum<sup>2</sup> tendencia y tend<sup>2</sup>     retardo 4º de la gripe</font></td>     <td VALIGN="top">    <p ALIGN="JUSTIFY"><font size="3">sen/cos de 1º orden retardo 7º de la     temperatura retardo 7º de la T<sup>2</sup> años retardos 4º y 5º de la gripe</font></td>   </tr>   <tr>     <td VALIGN="top">    <p ALIGN="JUSTIFY"><font size="3">CARDIOCIRCULATORIA</font></td>     <td VALIGN="top">    <p ALIGN="JUSTIFY"><font size="3">sen/cos de 1º, 5º y 6º orden retardo     6º de la temperatura humedad relativa, hum<sup>2</sup> y su 5º retardo años</font></td>     <td VALIGN="top">    <p ALIGN="JUSTIFY"><font size="3">sen/cos de 4º orden T<sup>2</sup>     humedad relativa y hum<sup>2</sup> </font></td>   </tr>   <tr>     <td VALIGN="top">    <p ALIGN="JUSTIFY"><font size="3">RESPIRATORIA</font></td>     <td VALIGN="top">    <p ALIGN="JUSTIFY"><font size="3">sen/cos de 1º y 5º orden retardo 4º     de la humedad relativa retardos 1º y 3º de la hum<sup>2</sup> retardo 7º de la gripe</font></td>     <td VALIGN="top">    <p ALIGN="JUSTIFY"><font size="3">retardos 3º y 4º de la temperatura     gripe</font></td>   </tr>   <tr>     <td VALIGN="top" colspan="3">    <p ALIGN="JUSTIFY"><font size="3">Notas: sen/cos: pareja de     términos sinusoidales; T<sup>2</sup>: función cuadrática de la temperatura media; hum<sup>2</sup>     : función cuadrática de la humedad relativa; tend<sup>2</sup> : función cuadrática de     la tendencia    ]]></body>
<body><![CDATA[<br>     Siguiendo el protocolo EMECAM se ha incluido siempre la variable día de la semana, como     una variable &quot;dummy&quot;.</font></td>   </tr> </table> </center></div>      <p ALIGN="JUSTIFY">&nbsp;</p>      <p ALIGN="JUSTIFY"><font size="3">En el modelado de las series de mortalidad se ha conseguido globalmente un buen ajuste, aunque no podemos descartar totalmente la existencia de factores no controlados que puedan afectar a las estimaciones de riesgo.</font></p>      <p ALIGN="JUSTIFY"><font size="3">En la <a href="#fig2">figura 2</a> podemos comprobar, a modo de ejemplo, la calidad del ajuste del modelo basal para la mortalidad total en Gijón y en Oviedo, mediante las series secuenciales de muertes observadas, muertes predichas por el modelo y residuos. Asimismo, se ha comprobado gráficamente la posible autocorrelación de los residuos y su eliminación tras la inclusión de las series retardadas de mortalidad en el modelo final, a través del uso de funciones de autocorrelación y autocorrelación parcial.</font></p>      <p ALIGN="JUSTIFY"><a name="fig2"></a>&nbsp;&nbsp; </p> <font color="#000000">      <p align="center"><font size="3"><strong>Figura 2    <br> Series de residuos, muertes observadas y esperadas en los modelos basales de mortalidad total.</strong></font></font></p>      <p ALIGN="center"><!-- big --><!-- big --><img src="/img/fbpe/resp/v73n2/ast2.gif" alt="ast2.gif (46718 bytes)"><!-- /big --><!-- /big --></p>      
<p ALIGN="center">&nbsp;</p>      <p ALIGN="center"><!-- big --><!-- big --><img src="/img/fbpe/resp/v73n2/ast3.gif" alt="ast3.gif (42435 bytes)"><!-- /big --><!-- /big --></p> <font color="#000000" size="3"><i>      
]]></body>
<body><![CDATA[<p></i></font>&nbsp;</p>      <p><font color="#000000" size="3">NOTA: Se ha sumado una constante (10 a los observados y 5 a los esperados) para evitar el solapamiento de las series en el gráfico.</font></p>      <p ALIGN="JUSTIFY"><font size="3">Las estimaciones de riesgos para cada contaminante presentan cierta similitud entre Gijón y Oviedo, como podemos comprobar en la <a href="#fig3">figura 3</a>. Los efectos más significativos no se encuentran siempre con el mismo retardo en ambas ciudades. En Gijón los efectos retardados 4 y 5 días son los que aparecen más frecuentemente como significativos. En Oviedo hay una mayor variabilidad en la máxima significación estadística de los efectos retardados. Debemos tener en cuenta que la probabilidad de asociación espúrea, probablemente, sea mayor cuanto más avanzado sea el retardo. </font></p>      <p ALIGN="JUSTIFY"><a name="fig3"></a>&nbsp;&nbsp; </p> <font color="#000000">      <p align="center"><font size="3"><strong>Figura 3    <br> Estimaciones de riesgo relativo e intervalos de confianza para cada contaminante y cada mortalidad, en ambas ciudades</strong></font></font></p>      <p ALIGN="center"><!-- big --><!-- big --><img src="/img/fbpe/resp/v73n2/ast4.gif" alt="ast4.gif (9839 bytes)"><!-- /big --><!-- /big --></p>      
<p ALIGN="JUSTIFY">&nbsp; </p>      <p ALIGN="center"><!-- big --><!-- big --><img src="/img/fbpe/resp/v73n2/ast5.gif" alt="ast5.gif (10113 bytes)"><!-- /big --><!-- /big --></p>      
<p align="center">&nbsp; </p>      ]]></body>
<body><![CDATA[<p align="center"><!-- big --><!-- big --><img src="/img/fbpe/resp/v73n2/ast6.gif" alt="ast6.gif (9514 bytes)"><!-- /big --><!-- /big --></p>      
<p ALIGN="center">&nbsp; </p>      <p ALIGN="center"><!-- big --><!-- big --><img src="/img/fbpe/resp/v73n2/ast7.gif" alt="ast7.gif (10279 bytes)"><!-- /big --><!-- /big --></p> <font size="3"><i>      
<p></i>&nbsp; </font></p>      <p><font size="3">NOTA: Están representados los retardos más significativos de cada contaminante</font></p>      <p ALIGN="JUSTIFY"><font size="3">En el análisis estratificado por semestres comprobamos que las estimaciones de riesgo difieren en el semestre frío (más próximas al efecto global) y el semestre cálido. Entre las posibles explicaciones estaría la diferente exposición &quot;efectiva&quot; a los contaminantes en ambos períodos, teniendo en cuenta que el tiempo que se permanece en el exterior es mayor en épocas cálidas que en las frías, aunque no podemos descartar otros factores.</font></p>      <p ALIGN="JUSTIFY"><font size="3">La mayor parte de las estimaciones de riesgo tienen intervalos de confianza que incluyen o están muy próximas al efecto nulo. En esta valoración deben tenerse en cuenta dos consideraciones: el número de habitantes (y por tanto el número de fallecimientos diario), tanto en Gijón como en Oviedo son moderados y los niveles de contaminación en ambas ciudades no pueden calificarse de excesivos. Por estos motivos era de esperar que los efectos detectables, si los hubiera, sean pequeños. A pesar de ello y teniendo en cuenta que prácticamente toda la población está expuesta al factor de riesgo contaminación, incluso la detección de riesgos relativos muy pequeños debe considerarse importante desde el punto de vista de la salud pública. En cualquier caso, la inclusión de estos datos en el análisis conjunto del estudio EMECAM, con un volumen muy importante de población y con representatividad de todo tipo de ciudades españolas, aumentaría la capacidad de detectar efectos significativos si los hubiera.</font></p>      <p ALIGN="JUSTIFY"><font size="3">Se han ensayado algunas alternativas al modelado propuesto en el protocolo, en cuanto a los criterios para introducir y mantener variables de control, con objeto de probar la estabilidad de los resultados. Aunque en la mayoría de los casos no varía el signo de las asociaciones, sí se observan pérdidas de significación estadística, con inclusión del valor &quot;no efecto&quot; en el intervalo de confianza.</font></p>      <p ALIGN="JUSTIFY"><font size="3">Teniendo en cuenta todo lo anterior, especialmente las inconsistencias en el sentido de la asociación y en el orden del retardo más significativo para un mismo contaminante respecto a las diferentes causas de mortalidad y la variabilidad de las estimaciones de riesgo obtenidas, con nuestros datos no podemos concluir la existencia de una clara asociación entre los niveles de contaminantes estudiados y la mortalidad.</font></p>      <p ALIGN="JUSTIFY"><font size="3">Un estudio de series temporales como este tiene, al menos, dos importantes ventajas: por un lado los factores de confusión que no varían de un día a otro (por ejemplo la proporción de fumadores en la población o el nivel socioeconómico de los individuos) no afectarían a las estimaciones; por otra parte, es más importante la estimación de las variaciones diarias de la contaminación que un conocimiento exacto de la exposición.</font></p>      ]]></body>
<body><![CDATA[<p ALIGN="JUSTIFY"><font size="3">Como todos los estudios ecológicos, la presente investigación tiene también una serie de limitaciones, la mayoría ligadas a la dificultad en la estimación de la exposición a los factores de riesgo. Por un lado, existe el riesgo de detectar asociaciones atribuibles a un sesgo de agregación o falacia ecológica. Por otra parte, aunque estamos atribuyendo una exposición común a toda la población, las diferencias entre los sensores indican que la exposición no es tan homogénea las correlaciones moderadas indicarían que los incrementos y reducciones en la exposición no son totalmente paralelos entre las distintas estaciones, por lo que la búsqueda de correlaciones con la mortalidad (medida de modo conjunto para todo el municipio) podría verse limitada. Una pequeña parte de la población del municipio (el 5% en Gijón y el 9% en Oviedo) reside fuera del casco urbano y no estaría sometida a los mismos niveles de contaminación. El hospital que atiende un mayor volumen de población en Gijón está fuera del casco urbano, y una proporción importante de fallecimientos se produce tras una estancia en el mismo, muchas veces de una duración mayor que el intervalo máximo entre exposición y efecto (5 días) utilizado en este trabajo. Respecto a la variable resultado, debemos tener en cuenta que la mortalidad es una variable sólo moderadamente sensible para detectar los efectos sobre la salud de la contaminación y que las agrupaciones de causas de mortalidad incluyen causas relativamente heterogéneas, que muy probablemente tengan diferente grado de asociación con los niveles de contaminación. </font></p>      <p ALIGN="JUSTIFY">&nbsp;</p> <b>      <p ALIGN="CENTER"><font size="4">BIBLIOGRAFÍA</font></b></p>      <!-- ref --><p ALIGN="JUSTIFY"><font size="3">1. Ware JH, Thibodeau LA, Speizer FE, Colome S, Ferris BG. Assessment of the health effects of atmospheric sulphur oxides and particulate matter: evidence from observational studies. Environ Health Perspect 1981; 41: 255-76</font>&nbsp;&nbsp;&nbsp;&nbsp;&nbsp;&nbsp;&nbsp;&nbsp;[&#160;<a href="javascript:void(0);" onclick="javascript: window.open('/scielo.php?script=sci_nlinks&ref=5568685&pid=S1135-5727199900020000800001&lng=','','width=640,height=500,resizable=yes,scrollbars=1,menubar=yes,');">Links</a>&#160;]<!-- end-ref --><!-- ref --><p ALIGN="JUSTIFY"><font size="3">2. Derriennic F, Richardson S, Mollie A, Lellouch J. Short-term effects of sulphur dioxide pollution on mortality in two French cities. International J Epidemiol 1989; 18: 186-97</font>&nbsp;&nbsp;&nbsp;&nbsp;&nbsp;&nbsp;&nbsp;&nbsp;[&#160;<a href="javascript:void(0);" onclick="javascript: window.open('/scielo.php?script=sci_nlinks&ref=5568686&pid=S1135-5727199900020000800002&lng=','','width=640,height=500,resizable=yes,scrollbars=1,menubar=yes,');">Links</a>&#160;]<!-- end-ref --><!-- ref --><p ALIGN="JUSTIFY"><font size="3">3. Schwartz J, Marcus A. Mortality and air pollution in London: a time series analysis. Am J Epidemiol 1990; 131: 185-94</font>&nbsp;&nbsp;&nbsp;&nbsp;&nbsp;&nbsp;&nbsp;&nbsp;[&#160;<a href="javascript:void(0);" onclick="javascript: window.open('/scielo.php?script=sci_nlinks&ref=5568687&pid=S1135-5727199900020000800003&lng=','','width=640,height=500,resizable=yes,scrollbars=1,menubar=yes,');">Links</a>&#160;]<!-- end-ref --><!-- ref --><p ALIGN="JUSTIFY"><font size="3">4. Sunyer J, Antó JM, Murillo C, Sáez M. Effects of urban air pollution on emergency room admissions for chronic obstructive pulmonary disease. Am J Epidemiol 1991; 134: 277-86</font>&nbsp;&nbsp;&nbsp;&nbsp;&nbsp;&nbsp;&nbsp;&nbsp;[&#160;<a href="javascript:void(0);" onclick="javascript: window.open('/scielo.php?script=sci_nlinks&ref=5568688&pid=S1135-5727199900020000800004&lng=','','width=640,height=500,resizable=yes,scrollbars=1,menubar=yes,');">Links</a>&#160;]<!-- end-ref --><!-- ref --><p ALIGN="JUSTIFY"><font size="3">5. Touloumi G, Pocock SJ, Katsouyanni K, Trichopoulos D. Short-term effects of air pollution on daily mortality in Athens: a time series analysis. Int J Epidemiol 1994; 23: 957-67</font>&nbsp;&nbsp;&nbsp;&nbsp;&nbsp;&nbsp;&nbsp;&nbsp;[&#160;<a href="javascript:void(0);" onclick="javascript: window.open('/scielo.php?script=sci_nlinks&ref=5568689&pid=S1135-5727199900020000800005&lng=','','width=640,height=500,resizable=yes,scrollbars=1,menubar=yes,');">Links</a>&#160;]<!-- end-ref --><!-- ref --><p ALIGN="JUSTIFY"><font size="3">6. Momas Y, Pirard P, Quenel P, Medina S, Le Moullec Y, Ferry R et al. Pollution atmosphérique urbaine et mortalité: une synthèse des études épidémiologiques publiées entre 1980 et 1991. Rev Epidémiol Santé Publ 1993; 41: 30-43</font>&nbsp;&nbsp;&nbsp;&nbsp;&nbsp;&nbsp;&nbsp;&nbsp;[&#160;<a href="javascript:void(0);" onclick="javascript: window.open('/scielo.php?script=sci_nlinks&ref=5568690&pid=S1135-5727199900020000800006&lng=','','width=640,height=500,resizable=yes,scrollbars=1,menubar=yes,');">Links</a>&#160;]<!-- end-ref --><!-- ref --><p ALIGN="JUSTIFY"><font size="3">7. Ballester Díaz F, Merino Egea C, Pérez Hoyos S. La asociación entre contaminación atmosférica y mortalidad: una revisión de los estudios epidemiológicos recientes. Rev Esp Salud Pública 1995; 69: 177-88</font>&nbsp;&nbsp;&nbsp;&nbsp;&nbsp;&nbsp;&nbsp;&nbsp;[&#160;<a href="javascript:void(0);" onclick="javascript: window.open('/scielo.php?script=sci_nlinks&ref=5568691&pid=S1135-5727199900020000800007&lng=','','width=640,height=500,resizable=yes,scrollbars=1,menubar=yes,');">Links</a>&#160;]<!-- end-ref --><!-- ref --><p ALIGN="JUSTIFY"><font size="3">8. Katsouyanni K, Zmirou D, Spix C, Sunyer J, Schouten JP, Pönka A et al. Short-term effects of air pollution on health: a European approach using epidemiological time-series data. The APHEA project: background, objectives, design. Eur Respir J 1995; 8: 1030-8</font>&nbsp;&nbsp;&nbsp;&nbsp;&nbsp;&nbsp;&nbsp;&nbsp;[&#160;<a href="javascript:void(0);" onclick="javascript: window.open('/scielo.php?script=sci_nlinks&ref=5568692&pid=S1135-5727199900020000800008&lng=','','width=640,height=500,resizable=yes,scrollbars=1,menubar=yes,');">Links</a>&#160;]<!-- end-ref --><!-- ref --><p ALIGN="JUSTIFY"><font size="3">9. Katsouyanni K, Schwartz J, Spix C, Touloumi G, Zmirou D, Zanobetti A et al. Short term effects of air pollution on health: a European approach using epidemiologic time series data: the APHEA protocol. J Epidemiol Community Health 1996; 50 Supl 1: S12-18</font>&nbsp;&nbsp;&nbsp;&nbsp;&nbsp;&nbsp;&nbsp;&nbsp;[&#160;<a href="javascript:void(0);" onclick="javascript: window.open('/scielo.php?script=sci_nlinks&ref=5568693&pid=S1135-5727199900020000800009&lng=','','width=640,height=500,resizable=yes,scrollbars=1,menubar=yes,');">Links</a>&#160;]<!-- end-ref --><!-- ref --><p ALIGN="JUSTIFY"><font size="3">10. Touloumi G, Katsouyanni K, Zmirou D, Schwartz J, Spix C, Ponce de León A. et al. Short-term effects of ambient oxidant exposure on mortality: a combined analysis within the APHEA project. Am J Epidemiol 1997; 146: 177-85</font>&nbsp;&nbsp;&nbsp;&nbsp;&nbsp;&nbsp;&nbsp;&nbsp;[&#160;<a href="javascript:void(0);" onclick="javascript: window.open('/scielo.php?script=sci_nlinks&ref=5568694&pid=S1135-5727199900020000800010&lng=','','width=640,height=500,resizable=yes,scrollbars=1,menubar=yes,');">Links</a>&#160;]<!-- end-ref --><!-- ref --><p ALIGN="JUSTIFY"><font size="3">11. Ballester F, Corella D, Pérez-Hoyos S, Hervás A. Air pollution and mortality in Valencia, Spain: a study using the APHEA methodology. J Epidemiol Community Health 1996; 50: 527-33</font>&nbsp;&nbsp;&nbsp;&nbsp;&nbsp;&nbsp;&nbsp;&nbsp;[&#160;<a href="javascript:void(0);" onclick="javascript: window.open('/scielo.php?script=sci_nlinks&ref=5568695&pid=S1135-5727199900020000800011&lng=','','width=640,height=500,resizable=yes,scrollbars=1,menubar=yes,');">Links</a>&#160;]<!-- end-ref --><!-- ref --><p ALIGN="JUSTIFY"><font size="3">12. Grupo de trabajo del Plan de Salud para Asturias. Calidad del Aire y Salud. En: Medio ambiente físico y salud. Documentos monográficos de apoyo al Plan de Salud para Asturias. Oviedo: Consejería de Sanidad y Servicios Sociales. 1993. p. 17-80</font>&nbsp;&nbsp;&nbsp;&nbsp;&nbsp;&nbsp;&nbsp;&nbsp;[&#160;<a href="javascript:void(0);" onclick="javascript: window.open('/scielo.php?script=sci_nlinks&ref=5568696&pid=S1135-5727199900020000800012&lng=','','width=640,height=500,resizable=yes,scrollbars=1,menubar=yes,');">Links</a>&#160;]<!-- end-ref --><!-- ref --><p ALIGN="JUSTIFY"><font size="3">13. Organización Mundial de la Salud. Manual de la Clasificación Estadística Internacional de Enfermedades, Traumatismos y Causas de Defunción. 9ª revisión. Publicación núm 353. Washington : Organización Panamericana de la Salud;1978</font>&nbsp;&nbsp;&nbsp;&nbsp;&nbsp;&nbsp;&nbsp;&nbsp;[&#160;<a href="javascript:void(0);" onclick="javascript: window.open('/scielo.php?script=sci_nlinks&ref=5568697&pid=S1135-5727199900020000800013&lng=','','width=640,height=500,resizable=yes,scrollbars=1,menubar=yes,');">Links</a>&#160;]<!-- end-ref --> ]]></body><back>
<ref-list>
<ref id="B1">
<label>1</label><nlm-citation citation-type="journal">
<person-group person-group-type="author">
<name>
<surname><![CDATA[Ware]]></surname>
<given-names><![CDATA[JH]]></given-names>
</name>
<name>
<surname><![CDATA[Thibodeau]]></surname>
<given-names><![CDATA[LA]]></given-names>
</name>
<name>
<surname><![CDATA[Speizer]]></surname>
<given-names><![CDATA[FE]]></given-names>
</name>
<name>
<surname><![CDATA[Colome]]></surname>
<given-names><![CDATA[S]]></given-names>
</name>
<name>
<surname><![CDATA[Ferris]]></surname>
<given-names><![CDATA[BG]]></given-names>
</name>
</person-group>
<article-title xml:lang="en"><![CDATA[Assessment of the health effects of atmospheric sulphur oxides and particulate matter: evidence from observational studies]]></article-title>
<source><![CDATA[Environ Health Perspect]]></source>
<year>1981</year>
<volume>41</volume>
<page-range>255-76</page-range></nlm-citation>
</ref>
<ref id="B2">
<label>2</label><nlm-citation citation-type="journal">
<person-group person-group-type="author">
<name>
<surname><![CDATA[Derriennic]]></surname>
<given-names><![CDATA[F]]></given-names>
</name>
<name>
<surname><![CDATA[Richardson]]></surname>
<given-names><![CDATA[S]]></given-names>
</name>
<name>
<surname><![CDATA[Mollie]]></surname>
<given-names><![CDATA[A]]></given-names>
</name>
<name>
<surname><![CDATA[Lellouch]]></surname>
<given-names><![CDATA[J]]></given-names>
</name>
</person-group>
<article-title xml:lang="en"><![CDATA[Short-term effects of sulphur dioxide pollution on mortality in two French cities]]></article-title>
<source><![CDATA[International J Epidemiol]]></source>
<year>1989</year>
<volume>18</volume>
<page-range>186-97</page-range></nlm-citation>
</ref>
<ref id="B3">
<label>3</label><nlm-citation citation-type="journal">
<person-group person-group-type="author">
<name>
<surname><![CDATA[Schwartz]]></surname>
<given-names><![CDATA[J]]></given-names>
</name>
<name>
<surname><![CDATA[Marcus]]></surname>
<given-names><![CDATA[A]]></given-names>
</name>
</person-group>
<article-title xml:lang="en"><![CDATA[Mortality and air pollution in London: a time series analysis]]></article-title>
<source><![CDATA[Am J Epidemiol]]></source>
<year>1990</year>
<volume>131</volume>
<page-range>185-94</page-range></nlm-citation>
</ref>
<ref id="B4">
<label>4</label><nlm-citation citation-type="journal">
<person-group person-group-type="author">
<name>
<surname><![CDATA[Sunyer]]></surname>
<given-names><![CDATA[J]]></given-names>
</name>
<name>
<surname><![CDATA[Antó]]></surname>
<given-names><![CDATA[JM]]></given-names>
</name>
<name>
<surname><![CDATA[Murillo]]></surname>
<given-names><![CDATA[C]]></given-names>
</name>
<name>
<surname><![CDATA[Sáez]]></surname>
<given-names><![CDATA[M]]></given-names>
</name>
</person-group>
<article-title xml:lang="en"><![CDATA[Effects of urban air pollution on emergency room admissions for chronic obstructive pulmonary disease]]></article-title>
<source><![CDATA[Am J Epidemiol]]></source>
<year>1991</year>
<volume>134</volume>
<page-range>277-86</page-range></nlm-citation>
</ref>
<ref id="B5">
<label>5</label><nlm-citation citation-type="journal">
<person-group person-group-type="author">
<name>
<surname><![CDATA[Touloumi]]></surname>
<given-names><![CDATA[G]]></given-names>
</name>
<name>
<surname><![CDATA[Pocock]]></surname>
<given-names><![CDATA[SJ]]></given-names>
</name>
<name>
<surname><![CDATA[Katsouyanni]]></surname>
<given-names><![CDATA[K]]></given-names>
</name>
<name>
<surname><![CDATA[Trichopoulos]]></surname>
<given-names><![CDATA[D]]></given-names>
</name>
</person-group>
<article-title xml:lang="en"><![CDATA[Short-term effects of air pollution on daily mortality in Athens: a time series analysis]]></article-title>
<source><![CDATA[Int J Epidemiol]]></source>
<year>1994</year>
<volume>23</volume>
<page-range>957-67</page-range></nlm-citation>
</ref>
<ref id="B6">
<label>6</label><nlm-citation citation-type="journal">
<person-group person-group-type="author">
<name>
<surname><![CDATA[Momas]]></surname>
<given-names><![CDATA[Y]]></given-names>
</name>
<name>
<surname><![CDATA[Pirard]]></surname>
<given-names><![CDATA[P]]></given-names>
</name>
<name>
<surname><![CDATA[Quenel]]></surname>
<given-names><![CDATA[P]]></given-names>
</name>
<name>
<surname><![CDATA[Medina]]></surname>
<given-names><![CDATA[S]]></given-names>
</name>
<name>
<surname><![CDATA[Le Moullec]]></surname>
<given-names><![CDATA[Y]]></given-names>
</name>
<name>
<surname><![CDATA[Ferry]]></surname>
<given-names><![CDATA[R]]></given-names>
</name>
</person-group>
<article-title xml:lang="fr"><![CDATA[Pollution atmosphérique urbaine et mortalité: une synthèse des études épidémiologiques publiées entre 1980 et 1991]]></article-title>
<source><![CDATA[Rev Epidémiol Santé Publ]]></source>
<year>1993</year>
<volume>41</volume>
<page-range>30-43</page-range></nlm-citation>
</ref>
<ref id="B7">
<label>7</label><nlm-citation citation-type="journal">
<person-group person-group-type="author">
<name>
<surname><![CDATA[Ballester Díaz]]></surname>
<given-names><![CDATA[F]]></given-names>
</name>
<name>
<surname><![CDATA[Merino Egea]]></surname>
<given-names><![CDATA[C]]></given-names>
</name>
<name>
<surname><![CDATA[Pérez Hoyos]]></surname>
<given-names><![CDATA[S]]></given-names>
</name>
</person-group>
<article-title xml:lang="es"><![CDATA[La asociación entre contaminación atmosférica y mortalidad: una revisión de los estudios epidemiológicos recientes]]></article-title>
<source><![CDATA[Rev Esp Salud Pública]]></source>
<year>1995</year>
<volume>69</volume>
<page-range>177-88</page-range></nlm-citation>
</ref>
<ref id="B8">
<label>8</label><nlm-citation citation-type="journal">
<person-group person-group-type="author">
<name>
<surname><![CDATA[Katsouyanni]]></surname>
<given-names><![CDATA[K]]></given-names>
</name>
<name>
<surname><![CDATA[Zmirou]]></surname>
<given-names><![CDATA[D]]></given-names>
</name>
<name>
<surname><![CDATA[Spix]]></surname>
<given-names><![CDATA[C]]></given-names>
</name>
<name>
<surname><![CDATA[Sunyer]]></surname>
<given-names><![CDATA[J]]></given-names>
</name>
<name>
<surname><![CDATA[Schouten]]></surname>
<given-names><![CDATA[JP]]></given-names>
</name>
<name>
<surname><![CDATA[Pönka]]></surname>
<given-names><![CDATA[A]]></given-names>
</name>
</person-group>
<article-title xml:lang="en"><![CDATA[Short-term effects of air pollution on health: a European approach using epidemiological time-series data. The APHEA project: background, objectives, design]]></article-title>
<source><![CDATA[Eur Respir J]]></source>
<year>1995</year>
<volume>8</volume>
<page-range>1030-8</page-range></nlm-citation>
</ref>
<ref id="B9">
<label>9</label><nlm-citation citation-type="journal">
<person-group person-group-type="author">
<name>
<surname><![CDATA[Katsouyanni]]></surname>
<given-names><![CDATA[K]]></given-names>
</name>
<name>
<surname><![CDATA[Schwartz]]></surname>
<given-names><![CDATA[J]]></given-names>
</name>
<name>
<surname><![CDATA[Spix]]></surname>
<given-names><![CDATA[C]]></given-names>
</name>
<name>
<surname><![CDATA[Touloumi]]></surname>
<given-names><![CDATA[G]]></given-names>
</name>
<name>
<surname><![CDATA[Zmirou]]></surname>
<given-names><![CDATA[D]]></given-names>
</name>
<name>
<surname><![CDATA[Zanobetti]]></surname>
<given-names><![CDATA[A]]></given-names>
</name>
</person-group>
<article-title xml:lang="en"><![CDATA[Short term effects of air pollution on health: a European approach using epidemiologic time series data: the APHEA protocol]]></article-title>
<source><![CDATA[J Epidemiol Community Health]]></source>
<year>1996</year>
<volume>50</volume>
<numero>^s1</numero>
<issue>^s1</issue>
<supplement>1</supplement>
<page-range>S12-18</page-range></nlm-citation>
</ref>
<ref id="B10">
<label>10</label><nlm-citation citation-type="journal">
<person-group person-group-type="author">
<name>
<surname><![CDATA[Touloumi]]></surname>
<given-names><![CDATA[G]]></given-names>
</name>
<name>
<surname><![CDATA[Katsouyanni]]></surname>
<given-names><![CDATA[K]]></given-names>
</name>
<name>
<surname><![CDATA[Zmirou]]></surname>
<given-names><![CDATA[D]]></given-names>
</name>
<name>
<surname><![CDATA[Schwartz]]></surname>
<given-names><![CDATA[J]]></given-names>
</name>
<name>
<surname><![CDATA[Spix]]></surname>
<given-names><![CDATA[C]]></given-names>
</name>
<name>
<surname><![CDATA[Ponce de León]]></surname>
<given-names><![CDATA[A]]></given-names>
</name>
</person-group>
<article-title xml:lang="en"><![CDATA[Short-term effects of ambient oxidant exposure on mortality: a combined analysis within the APHEA project]]></article-title>
<source><![CDATA[Am J Epidemiol]]></source>
<year>1997</year>
<volume>146</volume>
<page-range>177-85</page-range></nlm-citation>
</ref>
<ref id="B11">
<label>11</label><nlm-citation citation-type="journal">
<person-group person-group-type="author">
<name>
<surname><![CDATA[Ballester]]></surname>
<given-names><![CDATA[F]]></given-names>
</name>
<name>
<surname><![CDATA[Corella]]></surname>
<given-names><![CDATA[D]]></given-names>
</name>
<name>
<surname><![CDATA[Pérez-Hoyos]]></surname>
<given-names><![CDATA[S]]></given-names>
</name>
<name>
<surname><![CDATA[Hervás]]></surname>
<given-names><![CDATA[A]]></given-names>
</name>
</person-group>
<article-title xml:lang="en"><![CDATA[Air pollution and mortality in Valencia, Spain: a study using the APHEA methodology]]></article-title>
<source><![CDATA[J Epidemiol Community Health]]></source>
<year>1996</year>
<volume>50</volume>
<page-range>527-33</page-range></nlm-citation>
</ref>
<ref id="B12">
<label>12</label><nlm-citation citation-type="book">
<collab>Grupo de trabajo del Plan de Salud para Asturias</collab>
<article-title xml:lang="es"><![CDATA[Calidad del Aire y Salud]]></article-title>
<source><![CDATA[Medio ambiente físico y salud: Documentos monográficos de apoyo al Plan de Salud para Asturias]]></source>
<year>1993</year>
<page-range>17-80</page-range><publisher-loc><![CDATA[Oviedo ]]></publisher-loc>
<publisher-name><![CDATA[Consejería de Sanidad y Servicios Sociales]]></publisher-name>
</nlm-citation>
</ref>
<ref id="B13">
<label>13</label><nlm-citation citation-type="book">
<collab>Organización Mundial de la Salud</collab>
<source><![CDATA[Manual de la Clasificación Estadística Internacional de Enfermedades, Traumatismos y Causas de Defunción]]></source>
<year>1978</year>
<volume>353</volume>
<edition>9</edition>
<publisher-loc><![CDATA[Washington ]]></publisher-loc>
<publisher-name><![CDATA[Organización Panamericana de la Salud]]></publisher-name>
</nlm-citation>
</ref>
</ref-list>
</back>
</article>