<?xml version="1.0" encoding="ISO-8859-1"?><article xmlns:mml="http://www.w3.org/1998/Math/MathML" xmlns:xlink="http://www.w3.org/1999/xlink" xmlns:xsi="http://www.w3.org/2001/XMLSchema-instance">
<front>
<journal-meta>
<journal-id>1135-5727</journal-id>
<journal-title><![CDATA[Revista Española de Salud Pública]]></journal-title>
<abbrev-journal-title><![CDATA[Rev. Esp. Salud Publica]]></abbrev-journal-title>
<issn>1135-5727</issn>
<publisher>
<publisher-name><![CDATA[Ministerio de Sanidad]]></publisher-name>
</publisher>
</journal-meta>
<article-meta>
<article-id>S1135-57271999000200011</article-id>
<title-group>
<article-title xml:lang="es"><![CDATA[Efectos a corto plazo de la contaminación atmosférica sobre la mortalidad: resultados del proyecto EMECAM en Cartagena, 1992-96]]></article-title>
<article-title xml:lang="en"><![CDATA[The short-term impact of air pollution on the mortality. Results of the EMECAM project in Cartagena]]></article-title>
</title-group>
<contrib-group>
<contrib contrib-type="author">
<name>
<surname><![CDATA[Guillén Pérez]]></surname>
<given-names><![CDATA[José Jesús]]></given-names>
</name>
<xref ref-type="aff" rid="A01"/>
</contrib>
<contrib contrib-type="author">
<name>
<surname><![CDATA[Cirera Suárez]]></surname>
<given-names><![CDATA[Lluís]]></given-names>
</name>
<xref ref-type="aff" rid="A01"/>
</contrib>
<contrib contrib-type="author">
<name>
<surname><![CDATA[García-Marcos Álvarez]]></surname>
<given-names><![CDATA[Luis]]></given-names>
</name>
<xref ref-type="aff" rid="A02"/>
</contrib>
<contrib contrib-type="author">
<name>
<surname><![CDATA[Jiménez Torres]]></surname>
<given-names><![CDATA[Enrique]]></given-names>
</name>
<xref ref-type="aff" rid="A03"/>
</contrib>
<contrib contrib-type="author">
<name>
<surname><![CDATA[Barber Vallès]]></surname>
<given-names><![CDATA[Xavier]]></given-names>
</name>
<xref ref-type="aff" rid="A01"/>
</contrib>
<contrib contrib-type="author">
<name>
<surname><![CDATA[Martínez García]]></surname>
<given-names><![CDATA[María José]]></given-names>
</name>
<xref ref-type="aff" rid="A04"/>
</contrib>
<contrib contrib-type="author">
<name>
<surname><![CDATA[Moreno Grau]]></surname>
<given-names><![CDATA[Stella]]></given-names>
</name>
<xref ref-type="aff" rid="A04"/>
</contrib>
</contrib-group>
<aff id="A01">
<institution><![CDATA[,Dirección General de Salud  ]]></institution>
<addr-line><![CDATA[Murcia ]]></addr-line>
</aff>
<aff id="A02">
<institution><![CDATA[,Unidad de Investigación Clínico-epidemiológica  ]]></institution>
<addr-line><![CDATA[Cartagena ]]></addr-line>
</aff>
<aff id="A03">
<institution><![CDATA[,Ayuntamiento de Cartagena  ]]></institution>
<addr-line><![CDATA[ ]]></addr-line>
</aff>
<aff id="A04">
<institution><![CDATA[,Universidad de Murcia  ]]></institution>
<addr-line><![CDATA[ ]]></addr-line>
</aff>
<pub-date pub-type="pub">
<day>00</day>
<month>03</month>
<year>1999</year>
</pub-date>
<pub-date pub-type="epub">
<day>00</day>
<month>03</month>
<year>1999</year>
</pub-date>
<volume>73</volume>
<numero>2</numero>
<fpage>215</fpage>
<lpage>224</lpage>
<copyright-statement/>
<copyright-year/>
<self-uri xlink:href="http://scielo.isciii.es/scielo.php?script=sci_arttext&amp;pid=S1135-57271999000200011&amp;lng=en&amp;nrm=iso"></self-uri><self-uri xlink:href="http://scielo.isciii.es/scielo.php?script=sci_abstract&amp;pid=S1135-57271999000200011&amp;lng=en&amp;nrm=iso"></self-uri><self-uri xlink:href="http://scielo.isciii.es/scielo.php?script=sci_pdf&amp;pid=S1135-57271999000200011&amp;lng=en&amp;nrm=iso"></self-uri><abstract abstract-type="short" xml:lang="es"><p><![CDATA[FUNDAMENTO: Los problemas de contaminación atmosférica se han venido percibiendo en la ciudad de Cartagena desde la década de los setenta, con episodios puntuales de altos niveles de SO2 y partículas. Nos proponemos evaluar, utilizando la metodología del proyecto EMECAM, los efectos agudos de la contaminación atmosférica por SO2 y partículas sobre la mortalidad diaria en la ciudad de Cartagena de 1992 a 1996. MÉTODOS: se relacionan las defunciones diarias por todas las causas excepto las externas, en población general y en la de 70 y más años, por causas cardiovasculares y por causas respiratorias, con la contaminación atmosférica por dióxido de azufre y partículas, en el período1992-1996, utilizando modelos de Poisson autorregresiva que controlan por estacionalidad, meteorología, calendario, gripe, eventos especiales y retardos. RESULTADOS: En el periodo en estudio se ha producido una disminución de la contaminación por SO2, con respecto a años anteriores, lo que no ha sido evidente para la contaminación por partículas. Los análisis muestran asociaciones significativas en las defunciones totales sin accidentes en mayores de 69 años y el valor promedio de partículas, estas son las defunciones cardiovasculares del mes de mayo a octubre. En el semestre frío, encontramos asociación estadísticamente significativa positiva en el valor máximo horario diario de las partículas y las muertes por enfermedades cardiocirculatorias y respiratorias. Sin embargo no hay consistencia en las asociaciones al evaluar la fiabilidad de los modelos.]]></p></abstract>
<abstract abstract-type="short" xml:lang="en"><p><![CDATA[PURPOSE: The problems of air pollution became noticeable in Cartagena in the seventies, high SO2 and particle levels having been reached from time to time. Our aim is to assess, using the EMECAM methodology, the acute impact of SO2 and particle air pollution on the daily mortality of the city of Cartagena in the 1992-1996 period. METHODS: A daily listing is provided of the total number of non-accidental deaths within the population as a whole and for those over age 70, the cardiovascular and the respiratory deaths due to the sulfur dioxide and particle air pollution for the 1992-1996 period using autoregressive Poisson models which control seasonality, weather, time of year, flu, special events, and time lags. RESULTS: In the period under study, there has been a drop in the SO2 air pollution as compared to previous years, which was not as marked for the particles. The analyses reveal significant relationships in the total non-accidental deaths in those over age 69, with the average particle count and those particles with cardiovascular deaths for the months of May to October. In the six-month period of the year when the weather is cold, we found a positive statistically significant relationship to exist in the maximum daily hourly value of the particles and the deaths due to cardiocirculatory and respiratory diseases. However, there is no consistency in the between on assessing the reliability of the models.]]></p></abstract>
<kwd-group>
<kwd lng="es"><![CDATA[Mortalidad]]></kwd>
<kwd lng="es"><![CDATA[Contaminación atmosférica]]></kwd>
<kwd lng="es"><![CDATA[Efectos ambientales adversos]]></kwd>
<kwd lng="es"><![CDATA[Series temporales]]></kwd>
<kwd lng="es"><![CDATA[Regresión de Poisson]]></kwd>
<kwd lng="es"><![CDATA[Autocorrelación]]></kwd>
<kwd lng="es"><![CDATA[Enfermedades cardiovasculares]]></kwd>
<kwd lng="es"><![CDATA[Enfermedades respiratorias]]></kwd>
<kwd lng="es"><![CDATA[Dióxido de azufre]]></kwd>
<kwd lng="es"><![CDATA[Partículas en suspensión]]></kwd>
<kwd lng="en"><![CDATA[Mortality]]></kwd>
<kwd lng="en"><![CDATA[Air pollution]]></kwd>
<kwd lng="en"><![CDATA[Adverse environmental impact]]></kwd>
<kwd lng="en"><![CDATA[Short-term impact]]></kwd>
<kwd lng="en"><![CDATA[Time series]]></kwd>
<kwd lng="en"><![CDATA[Poisson regression]]></kwd>
<kwd lng="en"><![CDATA[Autocorrelation]]></kwd>
<kwd lng="en"><![CDATA[Cardiovascular diseases]]></kwd>
<kwd lng="en"><![CDATA[Respiratory diseases]]></kwd>
<kwd lng="en"><![CDATA[Sulfur dioxide]]></kwd>
<kwd lng="en"><![CDATA[Particles in suspension]]></kwd>
</kwd-group>
</article-meta>
</front><body><![CDATA[  <b>      <p ALIGN="CENTER"><a name="home"></a><font size="4">EFECTOS A CORTO PLAZO DE LA CONTAMINACIÓN ATMOSFÉRICA SOBRE LA MORTALIDAD: RESULTADOS DEL PROYECTO EMECAM EN CARTAGENA, 1992-96 (<a href="#home2">*</a>)</font></p>      <p ALIGN="CENTER">&nbsp;</p>      <p><font size="3">José Jesús Guillén Pérez (1), Lluís Cirera Suárez (1), Luis García-Marcos Álvarez (2), Enrique Jiménez Torres (3), Xavier Barber Vallès (1), María José Martínez García (4) y Stella Moreno Grau (4)     <br> (1) Dirección General de Salud. Consejería de Sanidad y Política Social. Murcia    <br> (2) Unidad de Investigación Clínico-epidemiológica. Cartagena    <br> (3) Servicio de Medio Ambiente. Ayuntamiento de Cartagena    <br> (4) Departamento de Ingeniería Química-Cartagena. Universidad de Murcia</font></p> </b>      <p ALIGN="JUSTIFY"><font size="3"><strong>Correspondencia&nbsp;    <br> José Jesús Guillén Pérez    ]]></body>
<body><![CDATA[<br> Servicio de Salud Pública. Cartagena    <br> Dirección General de Salud    <br> Plaza de San Agustín, 3. 30201 - Cartagena    <br> Tel. 968 502573; Fax 968 502570    <br> Correo electrónico: <a href="mailto:josej.guillen@carm.es">josej.guillen@carm.es</a></strong></font></p>      <p ALIGN="JUSTIFY"><a name="home2"></a><font size="3"><strong>(<a href="#home">*</a>) Este trabajo cuenta con una beca del Fondo de Investigaciones Sanitarias (Expediente núm 97/0051-09)</strong></font></p>  <hr>  <table border="0" width="100%">   <tr>     <td valign="top" width="48%">    <p align="center"><font size="3"><b>RESUMEN</b></font></p>         <p ALIGN="JUSTIFY"><font size="3"><b>Fundamento: </b>Los problemas de contaminación     atmosférica se han venido percibiendo en la ciudad de Cartagena desde la década de los     setenta, con episodios puntuales de altos niveles de SO<sub>2</sub> y partículas. Nos     proponemos evaluar, utilizando la metodología del proyecto <i>EMECAM</i>, los efectos     agudos de la contaminación atmosférica por SO<sub>2</sub> y partículas sobre la     mortalidad diaria en la ciudad de Cartagena de 1992 a 1996.</font></p>         <p ALIGN="JUSTIFY"><font size="3"><b>Métodos: </b>se relacionan las defunciones diarias     por todas las causas excepto las externas, en población general y en la de 70 y más     años, por causas cardiovasculares y por causas respiratorias, con la contaminación     atmosférica por dióxido de azufre y partículas, en el período1992-1996, utilizando     modelos de Poisson autorregresiva que controlan por estacionalidad, meteorología,     calendario, gripe, eventos especiales y retardos.</font></p>         <p ALIGN="JUSTIFY"><font size="3"><b>Resultados: </b>En el periodo en estudio se ha     producido una disminución de la contaminación por<b> </b>SO<sub>2,</sub> con respecto a     años anteriores, lo que no ha sido evidente para la contaminación por partículas. Los     análisis muestran asociaciones significativas en las defunciones totales sin accidentes     en mayores de 69 años y el valor promedio de partículas, estas son las defunciones     cardiovasculares del mes de mayo a octubre. En el semestre frío, encontramos asociación     estadísticamente significativa positiva en el valor máximo horario diario de las     partículas y las muertes por enfermedades cardiocirculatorias y respiratorias. Sin     embargo no hay consistencia en las asociaciones al evaluar la fiabilidad de los modelos. </font></p>         ]]></body>
<body><![CDATA[<p ALIGN="JUSTIFY"><font size="3"><b>Palabras clave: </b>Mortalidad. Contaminación     atmosférica. Efectos ambientales adversos, Efectos a corto plazo. Series temporales.     Regresión de Poisson. Autocorrelación. Enfermedades cardiovasculares. Enfermedades     respiratorias. Dióxido de azufre. Partículas en suspensión.</font></td>     <td width="4%"></td>     <td valign="top" width="48%">    <p align="center"><font size="3"><b>ABSTRACT</b></font></p>         <p ALIGN="CENTER"><font size="3"><b>The Short-term Impact of Air Pollution on the     Mortality. Results of the EMECAM Project in Cartagena</b></font></p>         <p ALIGN="JUSTIFY"><font size="3"><b>Purpose:</b> The problems of air pollution became     noticeable in Cartagena in the seventies, high SO<sub>2</sub> and particle levels having     been reached from time to time. Our aim is to assess, using the EMECAM methodology, the     acute impact of SO<sub>2</sub> and particle air pollution on the daily mortality of the     city of Cartagena in the 1992-1996 period.</font></p>         <p ALIGN="JUSTIFY"><font size="3"><b>Methods:</b> A daily listing is provided of the total     number of non-accidental deaths within the population as a whole and for those over age     70, the cardiovascular and the respiratory deaths due to the sulfur dioxide and particle     air pollution for the 1992-1996 period using autoregressive Poisson models which control     seasonality, weather, time of year, flu, special events, and time lags.</font></p>         <p ALIGN="JUSTIFY"><font size="3"><b>Results:</b> In the period under study, there has     been a drop in the SO<sub>2</sub> air pollution as compared to previous years, which was     not as marked for the particles. The analyses reveal significant relationships in the     total non-accidental deaths in those over age 69, with the average particle count and     those particles with cardiovascular deaths for the months of May to October. In the     six-month period of the year when the weather is cold, we found a positive statistically     significant relationship to exist in the maximum daily hourly value of the particles and     the deaths due to cardiocirculatory and respiratory diseases. However, there is no     consistency in the between on assessing the reliability of the models.</font></p>         <p ALIGN="JUSTIFY"><font size="3"><b>Key words:</b> Mortality. Air pollution. Adverse     environmental impact. Short-term impact. Time series. Poisson regression. Autocorrelation.     Cardiovascular diseases. Respiratory diseases. Sulfur dioxide. Particles in suspension.</font></td>   </tr> </table>  <hr> <b>      <p ALIGN="CENTER"><font size="4">INTRODUCCIÓN</font></p>      <p ALIGN="JUSTIFY"></b><font size="3">Los problemas de contaminación atmosférica se han venido percibiendo en la ciudad de Cartagena desde el comienzo de la década de los setenta<sup>1</sup>, con situaciones alarmantes debidas a las emisiones industriales y a las condiciones meteorológicas de dispersión de los contaminantes, que han ocasionado episodios puntuales de altos niveles de SO<sub>2</sub> y partículas. </font></p>      <p ALIGN="JUSTIFY"><font size="3">En los años de 1977 a 1980 las medias anuales se situaban entre los 200 y 300 µg/m<sup>3 </sup>(<a href="#fig1">figura1</a>). Así, el casco urbano de Cartagena y parte de su término municipal fueron declarados por el Real Decreto 1197/1979, como zonas de aplicación de las medidas previstas para áreas de atmósfera contaminada en la ley de Protección del Medio Ambiente Atmosférico. En 1978, en una estación medidora de la contaminación de origen industrial, las medias mensuales fueron superiores a los 600 µg/m<sup>3</sup> y en 155 días se superaron los 400 µg/m<sup>3</sup> de media diaria. </font></p>      ]]></body>
<body><![CDATA[<p ALIGN="JUSTIFY"><a name="fig1"></a>&nbsp; </p>      <p align="center"><font size="3"><strong>Figura 1    <br> </strong><b>Medias anuales de SO<sub>2 </sub>(m g/m<sup>3</sup>N). Cartagena 1973-1997</b></font></p>      <p ALIGN="center"><!-- big --><!-- big --><img src="/img/fbpe/resp/v73n2/cartg1.gif" alt="cartg1.gif (19485 bytes)"><!-- /big --><!-- /big --></p>      
<p ALIGN="center">&nbsp; </p>      <p ALIGN="JUSTIFY"><font size="3">Esta situación llevó al Ayuntamiento de la Ciudad a establecer un Servicio de Medio Ambiente para conocer tanto los niveles de inmisión como las emisiones de las industrias, y al establecimiento de medidas para solucionar la contaminación del medio atmosférico. Esto condujo a que, tras un episodio de contaminación por SO<sub>2</sub> en diciembre de 1990, se estableciese un Plan Operativo de Intervención sobre la contaminación atmosférica de origen industrial, en la que, tras recibir información de la Central de Datos de Medio Ambiente, se insta a las empresas a disminuir carga o a parar los procesos cuando se observa que la media de 24 horas puede aumentar por encima de los límites establecidos.</font></p>      <p ALIGN="JUSTIFY"><font size="3">No son numerosos, sin embargo, los estudios que relacionan la mortalidad y la contaminación en Cartagena, aunque es de destacar el que analiza patrones diferenciales de mortalidad e incidencia de cáncer en el ámbito de Cartagena<sup>2 </sup>con otras áreas geográficas regionales que se consideraban menos expuestas a contaminación, observándose una mayor mortalidad por cáncer de pulmón, próstata y vejiga en hombres, y por enfermedad coronaria en ambos sexos en 1984-85, y de incidencia para los mismos cánceres en hombres en 1983-85.</font></p>      <p ALIGN="JUSTIFY"><font size="3">También hay que reseñar el estudio<sup> </sup>que se hizo entre 1989 y 1991<sup>3</sup>, en el que se concluye que había un exceso de afluencia a urgencias de casos de asma cuando el SO<sub>2</sub> superaba los 80,6 m g/m<sup>3</sup>.</font></p>      <p ALIGN="JUSTIFY"><font size="3">Nos proponemos evaluar el impacto de la contaminación atmosférica sobre la mortalidad diaria en la ciudad de Cartagena, en el período de 1992 a 1996, analizando la asociación de los efectos agudos por SO<sub>2</sub> y partículas sobre distintos tipos de causas de defunción, utilizando la metodología del proyecto <i>EMECAM.</i>.</font></p>      <p><b>&nbsp;</p>      ]]></body>
<body><![CDATA[<p ALIGN="CENTER"><font size="4">MATERIAL Y MÉTODOS</font></b></p>      <p ALIGN="JUSTIFY"><font size="3">El Municipio de Cartagena abarca una superficie de<sup> </sup>557 km<sup>2 </sup>con una población de 180.553 habitantes en el padrón corregido de 1995. El de 1996 refleja 170.483 habitantes y el de 1991 168.023. No significa que haya habido oscilaciones en el número de habitantes sino que, dado el bajo registro de los mismos, hay que esperar las correcciones para conocer la población de forma más exacta. Se puede decir que ésta ha permanecido estable en cuanto a número, pero con el consiguiente envejecimiento. Los menores de 5 años representan el 4,47% y los que tienen 65 o más años el 14,1%, siendo el 66,16% los de 5 a 49 años y el 15,27% los de 50 a 64 años.</font></p>      <p ALIGN="JUSTIFY"><font size="3">Utilizamos las defunciones diarias de los habitantes residentes ocurridas en el municipio de Cartagena, información cedida por el Centro Regional de Estadística de Murcia. Un pequeño porcentaje (4% en 1995) de los habitantes fallece en la ciudad de Murcia, donde se ubica el hospital regional de referencia (Virgen de la Arrixaca). Estudiadas sus causas de defunción, se decidió excluirlos por presentar patologías no ligadas al posible efecto biológico de la contaminación (sobre todo accidentes de tráfico o de evolución crónica como algún tipo de tumor).</font></p>      <p ALIGN="JUSTIFY"><font size="3">Siguiendo el protocolo del proyecto <i>EMECAM</i><sup>4,5</sup> utilizamos como variables meteorológicas la temperatura media diaria y la humedad relativa diaria (media de la humedad a las 0, 7, 13, y 18 horas) facilitadas por el Instituto Nacional de Meteorología de la estación medidora de Capitanía General de la Zona Marítima del Mediterráneo, ubicada en el casco antiguo de la ciudad.</font></p> <b>      <p ALIGN="JUSTIFY"></b><font size="3">En el periodo estudiado, el Centro de Control del Departamento de Medio Ambiente del Ayuntamiento de Cartagena disponía de 12 estaciones medidoras, la mayoría de ellas con funcionamiento automático y con registro informático desde su puesta en marcha en los últimos años. Cinco de ellas, las más antiguas, habían registrado todo el período 1992-1996, pero la instalada en el Puerto de Cartagena se trasladó en 1995. La ubicada en Alumbres (ER2) no está situada en zona urbana, ya que es una pedanía que se encuentra junto al complejo industrial de Escombreras. Las tres restantes, Lo Campano (ER1), Bastarreche (ER3) y Pista deportiva-San Ginés (ER5), cumplían el requisito de estar en zona urbana, por lo que fueron seleccionadas (<a href="#fig2">figura 2</a>).</font></p>      <p ALIGN="JUSTIFY"><a name="fig2"></a>&nbsp;&nbsp; </p> <b>      <p ALIGN="CENTER"><font size="3">Figura 2    <br> Situación de la red de estaciones medidoras de contaminación en Cartagena (1 a 5)</font></b></p>      <p ALIGN="center"><!-- big --><!-- big --><img src="/img/fbpe/resp/v73n2/cartg2.gif" alt="cartg2.gif (142270 bytes)"><!-- /big --><!-- /big --></p>      
<blockquote>       ]]></body>
<body><![CDATA[<blockquote>         <blockquote>           <blockquote>             <p align="left"><font size="3">1 Lo Campano    <br>         2 Alumbres    <br>         3 Bastarreche    <br>         4 Puerto    <br>         5 San Ginés</font></p>             <p align="left">&nbsp;</p>       </blockquote>     </blockquote>   </blockquote> </blockquote>      <p ALIGN="JUSTIFY"><font size="3">Como variables de contaminación utilizamos el SO<sub>2</sub> y las partículas totales en suspensión, en ambos casos la media de 24 horas y valor horario máximo diario (max. hor.), medidas por las tres estaciones automáticas de forma instantánea y que cumplían con el requisito de ser urbanas.</font></p>      ]]></body>
<body><![CDATA[<p ALIGN="JUSTIFY"><font size="3">Decidimos comenzar en enero de 1992, ya que de septiembre a noviembre de 1991 en las estaciones se sustituyó el analizador de partículas existente (se quitó el nefelómetro SIGRST por un gravimétrico TEOM1400), habiéndose encontrado diferencias en los resultados con los dos métodos.</font></p>      <p ALIGN="JUSTIFY"><font size="3">Los casos de gripe en la ciudad se obtuvieron del Sistema de Declaración de Enfermedades de Declaración Obligatoria de la Comunidad Autónoma.</font></p> <b>      <p ALIGN="JUSTIFY"><font size="3">Plan Operativo de intervención municipal</font></b></p>      <p ALIGN="JUSTIFY"><font size="3">La existencia del Plan Operativo<sup>6</sup>, único en su configuración, ha ocasionado que se evite en gran medida la aparición de días con alta contaminación, como ocurría en el pasado. El Plan Operativo compromete a las empresas, vistas las cifras de contaminantes en las estaciones, a que procediesen a bajar carga (se interviene si el SO<sub>2</sub> es de 400 m g/m<sup>3</sup> en 15 minutos, 250m g/m<sup>3</sup> en 3 horas o 200 m g/m<sup>3</sup> en cuatro horas o las partículas son de 130 m g/m<sup>3</sup> durante cuatro horas) o parar la producción de la empresa (si la situación no se corregía en una hora con la bajada de carga o si las condiciones ambientales hacían prever que no se solucionara el episodio).</font></p> <b>      <p ALIGN="JUSTIFY"><font size="3">Análisis estadísticos</font></b></p>      <p ALIGN="JUSTIFY"><font size="3">El estudio se realizó tomando el día como unidad de análisis. Las correlaciones entre variables meteorológicas y contaminantes, las efectuamos mediante el coeficiente de correlación de Spearman<sup>7</sup>. La asociación entre los niveles de contaminantes y el número de fallecimientos se probó mediante modelos de Poisson autorregresiva para cada tipo de mortalidad, en el que se incluyen la variedad de contaminante atmosférico, la estacionalidad, la meteorología, el calendario, la incidencia de gripe, los eventos especiales, y sus respectivos retardos. El posible efecto del contaminante sobre las defunciones se explora hasta el quinto retardo. La estimación puntual del riesgo (RR) y su intervalo de confianza al 95%, están medidas en número de defunciones diarias por cada 10µg/m<sup>3 </sup>de contaminante<sup>8</sup>. En los semestres cálidos y fríos elaboramos dos modelos: a) con el mismo modelo de todo el período añadíamos la interacción contaminante/semestre; b) modelos específicos, distintos al modelo del período anual total, aplicando de nuevo el protocolo para los datos del semestre.</font></p>      <p ALIGN="JUSTIFY"><font size="3">Para comprobar la consistencia de la parametrización de los modelos se realizó el análisis de fiabilidad, que consiste en reproducir el modelo obtenido introduciendo, en primer lugar, el tipo de contaminante atmosférico y, secuencialmente, las variables indicadas en el protocolo, tanto para los modelos de todo el período como para los semestres, comprobando las variables que son distintas, y las magnitudes y significación de los coeficientes de regresión para el contaminante.</font></p> <b>      <p ALIGN="CENTER">&nbsp;</p>      <p ALIGN="CENTER"><font size="4">RESULTADOS</font></p>      <p ALIGN="JUSTIFY"></b><font size="3">En el periodo<b> </b>de estudio Cartagena ha presentado unas condiciones climáticas acordes a su situación mediterránea, con un valor mínimo de la temperatura media diaria de 7,2ºC y máxima de 30,8ºC. La humedad relativa en el periodo fue del 75,24%, habiendo disminuido desde 1995 en los que se manifestó una pertinaz sequía. </font></p>      ]]></body>
<body><![CDATA[<p ALIGN="JUSTIFY"><font size="3">Ha sido evidente la disminución de SO<sub>2 </sub>a lo largo del periodo (<a href="#tab1">tabla 1</a>); así la media anual de SO<sub>2</sub> de las tres estaciones medidoras utilizadas en 1992 fue de 51,69m g/m<sup>3 </sup>y en 1997 de 23,5m g/m<sup>3</sup>. También ha existido una tendencia decreciente de la media de partículas aunque no de forma tan llamativa (65,93m g/m<sup>3</sup> en 1992 y 49,77m g/m<sup>3</sup> en 1997), sin embargo, los valores máximos diarios siguen presentando niveles similares a lo largo del periodo.</font></p>      <p ALIGN="JUSTIFY"><a name="tab1"></a></p> <b>      <p ALIGN="CENTER"><font size="3">Tabla 1    <br> Valores medios anuales de SO<sub>2</sub> y Partículas(µg/m<sup>3</sup>N) según la estación captadora. Cartagena, 1985-1997</font></p> </b>    <div align="center">    <center>  <table BORDER="0" CELLSPACING="1" bgcolor="#ECECEC">   <tr>     <td VALIGN="top" bgcolor="#C0C0C0">&nbsp;&nbsp;&nbsp;&nbsp; </td>     <td VALIGN="top" COLSPAN="6" bgcolor="#C0C0C0"><b>    <p ALIGN="CENTER"><font size="3">SO<sub>2</sub></font></b></td>     <td VALIGN="top" COLSPAN="6" bgcolor="#C0C0C0"><b>    <p ALIGN="CENTER"><font size="3">PARTÍCULAS</font></b></td>       </tr>       <tr>     ]]></body>
<body><![CDATA[    <td VALIGN="top" bgcolor="#C0C0C0"><font size="3"><i><b>Estaciones captadoras</b></i></font></td>         <td VALIGN="top" bgcolor="#C0C0C0"><font size="3"><i>ER1</i></font></td>         <td VALIGN="top" bgcolor="#C0C0C0"><font size="3"><i>ER3</i></font></td>         <td VALIGN="top" bgcolor="#C0C0C0"><font size="3"><i>ER5</i></font></td>         <td VALIGN="top" bgcolor="#C0C0C0"><font size="3"><i>ER2</i></font></td>         <td VALIGN="top" bgcolor="#C0C0C0"><font size="3"><i>ER4</i></font></td>         <td VALIGN="top" bgcolor="#C0C0C0"><font size="3"><i>MEDIA ER1,3,5</i></font></td>         <td VALIGN="top" bgcolor="#C0C0C0"><font size="3"><i>ER1</i></font></td>         <td VALIGN="top" bgcolor="#C0C0C0"><font size="3"><i>ER3</i></font></td>         <td VALIGN="top" bgcolor="#C0C0C0"><font size="3"><i>ER5</i></font></td>     ]]></body>
<body><![CDATA[    <td VALIGN="top" bgcolor="#C0C0C0"><font size="3"><i>ER2</i></font></td>         <td VALIGN="top" bgcolor="#C0C0C0"><font size="3"><i>ER4</i></font></td>         <td VALIGN="top" bgcolor="#C0C0C0"><font size="3"><i>MEDIA ER1,3,5</i></font></td>       </tr>       <tr>         <td VALIGN="top"><font size="3"><i>1985</i></font></td>         <td VALIGN="top"><font size="3">119</font></td>         <td VALIGN="top"><font size="3">75</font></td>         <td VALIGN="top"><font size="3">--</font></td>         <td VALIGN="top"><font size="3">38</font></td>     ]]></body>
<body><![CDATA[    <td VALIGN="top"><font size="3">--</font></td>         <td VALIGN="top"><font size="3">97</font></td>         <td VALIGN="top"><font size="3">--</font></td>         <td VALIGN="top"><font size="3">--</font></td>         <td VALIGN="top"><font size="3">--</font></td>         <td VALIGN="top"><font size="3">--</font></td>         <td VALIGN="top"><font size="3">--</font></td>         <td VALIGN="top"><font size="3">--</font></td>       </tr>       <tr>     ]]></body>
<body><![CDATA[    <td VALIGN="top"><font size="3"><i>1986</i></font></td>         <td VALIGN="top"><font size="3">107</font></td>         <td VALIGN="top"><font size="3">48</font></td>         <td VALIGN="top"><font size="3">--</font></td>         <td VALIGN="top"><font size="3">48</font></td>         <td VALIGN="top"><font size="3">--</font></td>         <td VALIGN="top"><font size="3">77,5</font></td>         <td VALIGN="top"><font size="3">--</font></td>         <td VALIGN="top"><font size="3">--</font></td>         <td VALIGN="top"><font size="3">--</font></td>     ]]></body>
<body><![CDATA[    <td VALIGN="top"><font size="3">--</font></td>         <td VALIGN="top"><font size="3">--</font></td>         <td VALIGN="top"><font size="3">--</font></td>       </tr>       <tr>         <td VALIGN="top"><font size="3"><i>1987</i></font></td>         <td VALIGN="top"><font size="3">98</font></td>         <td VALIGN="top"><font size="3">32</font></td>         <td VALIGN="top"><font size="3">36</font></td>         <td VALIGN="top"><font size="3">36</font></td>     ]]></body>
<body><![CDATA[    <td VALIGN="top"><font size="3">30</font></td>         <td VALIGN="top"><font size="3">55,33</font></td>         <td VALIGN="top"><font size="3">--</font></td>         <td VALIGN="top"><font size="3">--</font></td>         <td VALIGN="top"><font size="3">--</font></td>         <td VALIGN="top"><font size="3">--</font></td>         <td VALIGN="top"><font size="3">--</font></td>         <td VALIGN="top"><font size="3">--</font></td>       </tr>       <tr>     ]]></body>
<body><![CDATA[    <td VALIGN="top"><font size="3"><i>1988</i></font></td>         <td VALIGN="top"><font size="3">124</font></td>         <td VALIGN="top"><font size="3">62</font></td>         <td VALIGN="top"><font size="3">31</font></td>         <td VALIGN="top"><font size="3">23</font></td>         <td VALIGN="top"><font size="3">41</font></td>         <td VALIGN="top"><font size="3">72,33</font></td>         <td VALIGN="top"><font size="3">58,5</font></td>         <td VALIGN="top"><font size="3">78,9</font></td>         <td VALIGN="top"><font size="3">43,05</font></td>     ]]></body>
<body><![CDATA[    <td VALIGN="top"><font size="3">76,89</font></td>         <td VALIGN="top"><font size="3">30,18</font></td>         <td VALIGN="top"><font size="3">60,15</font></td>       </tr>       <tr>         <td VALIGN="top"><font size="3"><i>1989</i></font></td>         <td VALIGN="top"><font size="3">99</font></td>         <td VALIGN="top"><font size="3">99</font></td>         <td VALIGN="top"><font size="3">40</font></td>         <td VALIGN="top"><font size="3">48</font></td>     ]]></body>
<body><![CDATA[    <td VALIGN="top"><font size="3">34</font></td>         <td VALIGN="top"><font size="3">79,33</font></td>         <td VALIGN="top"><font size="3">59,78</font></td>         <td VALIGN="top"><font size="3">71,17</font></td>         <td VALIGN="top"><font size="3">55,74</font></td>         <td VALIGN="top"><font size="3">50,78</font></td>         <td VALIGN="top"><font size="3">62,71</font></td>         <td VALIGN="top"><font size="3">62,23</font></td>       </tr>       <tr>     ]]></body>
<body><![CDATA[    <td VALIGN="top"><font size="3"><i>1990</i></font></td>         <td VALIGN="top"><font size="3">82</font></td>         <td VALIGN="top"><font size="3">101</font></td>         <td VALIGN="top"><font size="3">22</font></td>         <td VALIGN="top"><font size="3">45</font></td>         <td VALIGN="top"><font size="3">29</font></td>         <td VALIGN="top"><font size="3">68,33</font></td>         <td VALIGN="top"><font size="3">56,79</font></td>         <td VALIGN="top"><font size="3">68,95</font></td>         <td VALIGN="top"><font size="3">59,57</font></td>     ]]></body>
<body><![CDATA[    <td VALIGN="top"><font size="3">61,23</font></td>         <td VALIGN="top"><font size="3">70,98</font></td>         <td VALIGN="top"><font size="3">61,77</font></td>       </tr>       <tr>         <td VALIGN="top"><font size="3"><i>1991</i></font></td>         <td VALIGN="top"><font size="3">76</font></td>         <td VALIGN="top"><font size="3">87</font></td>         <td VALIGN="top"><font size="3">27</font></td>         <td VALIGN="top"><font size="3">29</font></td>     ]]></body>
<body><![CDATA[    <td VALIGN="top"><font size="3">36</font></td>         <td VALIGN="top"><font size="3">63,33</font></td>         <td VALIGN="top"><font size="3">36,54</font></td>         <td VALIGN="top"><font size="3">71,67</font></td>         <td VALIGN="top"><font size="3">69,44</font></td>         <td VALIGN="top"><font size="3">63,12</font></td>         <td VALIGN="top"><font size="3">75,41</font></td>         <td VALIGN="top"><font size="3">59,22</font></td>       </tr>       <tr>     ]]></body>
<body><![CDATA[    <td VALIGN="top"><font size="3"><i>1992</i></font></td>         <td VALIGN="top"><font size="3">46,85</font></td>         <td VALIGN="top"><font size="3">80,38</font></td>         <td VALIGN="top"><font size="3">27,85</font></td>         <td VALIGN="top"><font size="3">35,81</font></td>         <td VALIGN="top"><font size="3">29,64</font></td>         <td VALIGN="top"><font size="3">51,69</font></td>         <td VALIGN="top"><font size="3">56,79</font></td>         <td VALIGN="top"><font size="3">99,23</font></td>         <td VALIGN="top"><font size="3">41,77</font></td>     ]]></body>
<body><![CDATA[    <td VALIGN="top"><font size="3">43,95</font></td>         <td VALIGN="top"><font size="3">58,30</font></td>         <td VALIGN="top"><font size="3">65,93</font></td>       </tr>       <tr>         <td VALIGN="top"><font size="3"><i>1993</i></font></td>         <td VALIGN="top"><font size="3">34,21</font></td>         <td VALIGN="top"><font size="3">83,0</font></td>         <td VALIGN="top"><font size="3">30,26</font></td>         <td VALIGN="top"><font size="3">40,17</font></td>     ]]></body>
<body><![CDATA[    <td VALIGN="top"><font size="3">34,92</font></td>         <td VALIGN="top"><font size="3">49,16</font></td>         <td VALIGN="top"><font size="3">44,56</font></td>         <td VALIGN="top"><font size="3">80,02</font></td>         <td VALIGN="top"><font size="3">19,32</font></td>         <td VALIGN="top"><font size="3">42,41</font></td>         <td VALIGN="top"><font size="3">58,55</font></td>         <td VALIGN="top"><font size="3">47,97</font></td>       </tr>       <tr>     ]]></body>
<body><![CDATA[    <td VALIGN="top"><font size="3"><i>1994</i></font></td>         <td VALIGN="top"><font size="3">28,38</font></td>         <td VALIGN="top"><font size="3">60,07</font></td>         <td VALIGN="top"><font size="3">26,27</font></td>         <td VALIGN="top"><font size="3">40,18</font></td>         <td VALIGN="top"><font size="3">20,43</font></td>         <td VALIGN="top"><font size="3">38,24</font></td>         <td VALIGN="top"><font size="3">51,97</font></td>         <td VALIGN="top"><font size="3">99,08</font></td>         <td VALIGN="top"><font size="3">42,17</font></td>     ]]></body>
<body><![CDATA[    <td VALIGN="top"><font size="3">52,67</font></td>         <td VALIGN="top"><font size="3">65,52</font></td>         <td VALIGN="top"><font size="3">64,41</font></td>       </tr>       <tr>         <td VALIGN="top"><font size="3"><i>1995</i></font></td>         <td VALIGN="top"><font size="3">30,04</font></td>         <td VALIGN="top"><font size="3">55,78</font></td>         <td VALIGN="top"><font size="3">19,01</font></td>         <td VALIGN="top"><font size="3">49,46</font></td>     ]]></body>
<body><![CDATA[    <td VALIGN="top"><font size="3">--</font></td>         <td VALIGN="top"><font size="3">34,94</font></td>         <td VALIGN="top"><font size="3">50,78</font></td>         <td VALIGN="top"><font size="3">91,82</font></td>         <td VALIGN="top"><font size="3">28,82</font></td>         <td VALIGN="top"><font size="3">48,08</font></td>         <td VALIGN="top"><font size="3">--</font></td>         <td VALIGN="top"><font size="3">57,14</font></td>       </tr>       <tr>     ]]></body>
<body><![CDATA[    <td VALIGN="top"><font size="3"><i>1996</i></font></td>         <td VALIGN="top"><font size="3">44,3</font></td>         <td VALIGN="top"><font size="3">67,19</font></td>         <td VALIGN="top"><font size="3">23,14</font></td>         <td VALIGN="top"><font size="3">34,08</font></td>         <td VALIGN="top"><font size="3">--</font></td>         <td VALIGN="top"><font size="3">44,88</font></td>         <td VALIGN="top"><font size="3">48,08</font></td>         <td VALIGN="top"><font size="3">56,8</font></td>         <td VALIGN="top"><font size="3">30,56</font></td>     ]]></body>
<body><![CDATA[    <td VALIGN="top"><font size="3">42,12</font></td>         <td VALIGN="top"><font size="3">--</font></td>         <td VALIGN="top"><font size="3">45,15</font></td>       </tr>       <tr>         <td VALIGN="top"><font size="3"><i>1997</i></font></td>         <td VALIGN="top"><font size="3">26,1</font></td>         <td VALIGN="top"><font size="3">30,2</font></td>         <td VALIGN="top"><font size="3">14,2</font></td>         <td VALIGN="top"><font size="3">13,6</font></td>     ]]></body>
<body><![CDATA[    <td VALIGN="top"><font size="3">--</font></td>         <td VALIGN="top"><font size="3">23,5</font></td>         <td VALIGN="top"><font size="3">49,5</font></td>         <td VALIGN="top"><font size="3">64</font></td>         <td VALIGN="top"><font size="3">35,8</font></td>         <td VALIGN="top"><font size="3">45,3</font></td>         <td VALIGN="top"><font size="3">--</font></td>         <td VALIGN="top"><font size="3">49,77</font></td>       </tr>       <tr>     ]]></body>
<body><![CDATA[    <td VALIGN="top"><font size="3"><i>Media del período</i></font></td>         <td VALIGN="top"><font size="3">70,38</font></td>         <td VALIGN="top"><font size="3">67,74</font></td>         <td VALIGN="top"><font size="3">26,98</font></td>         <td VALIGN="top"><font size="3">36,95</font></td>         <td VALIGN="top"><font size="3">31,87</font></td>         <td VALIGN="top"><font size="3">58,12</font></td>         <td VALIGN="top"><font size="3">51,39</font></td>         <td VALIGN="top"><font size="3">78,16</font></td>         <td VALIGN="top"><font size="3">42,62</font></td>     ]]></body>
<body><![CDATA[    <td VALIGN="top"><font size="3">52,66</font></td>         <td VALIGN="top"><font size="3">60,24</font></td>         <td VALIGN="top"><font size="3">57,39</font></td>       </tr>       <tr>         <td VALIGN="top" colspan="13"><i><!-- big -->ER1<!-- /big --> </i>Lo Campano<!-- big -->    <br>     <i>ER2</i> <!-- /big -->Alumbres<!-- big -->    <br>     <i>ER3</i> <!-- /big -->Bastarreche<!-- big -->    <br>     <i>ER4</i> <!-- /big -->Puerto<!-- big -->    <br>     <i>ER5</i> <!-- /big -->San Ginés</td>   </tr> </table> </center></div>      ]]></body>
<body><![CDATA[<p ALIGN="JUSTIFY">&nbsp;</p>      <p ALIGN="JUSTIFY"><font size="3">Es necesario investigar la influencia del Plan Operativo en el comportamiento de los contaminantes. El número de días con intervención en el Plan Operativo en el periodo fue de 352 (19,27%) presentando una distribución estacional debido a su relación con las condiciones climáticas (<a href="#fig3">figura 3</a>). Los días de intervención presentaron de forma significativa valores más altos de los contaminantes medidos que los días que no hubo intervención ( SO<sub>2 </sub>59,8 m g/m<sup>3</sup> frente a 40m g/m<sup>3</sup> , partículas 73,1m g/m<sup>3</sup> frente a 51,7 m g/m<sup>3</sup>, SO<sub>2</sub> max.hor.185,22 m g/m<sup>3</sup> frente a 95,96 m g/m<sup>3</sup>, partículas max.hor. 253 m g/m<sup>3</sup> frente a 160,39 m g/m<sup>3</sup>). La media de defunciones sin accidentes en el periodo ha sido de 3,5 diarias, oscilando de 4 en invierno a 3,2 en verano, siendo la media diaria de las defunciones por causas respiratorias de 0,4; las cardiovasculares de 1,4 y de 2,4 en las personas de 70 y más años (<a href="#tab2">tabla 2</a>). Las correlaciones entre los valores promedio de temperatura, humedad relativa y los tipos de contaminantes atmosféricos, es baja en las tres estaciones captadoras. También es baja entre los índices de medición del dióxido de azufre y las partículas (<a href="#tab3">tabla 3</a>).</font></p>      <p ALIGN="JUSTIFY"><a name="fig3"></a>&nbsp; </p>      <p ALIGN="center"><font size="3"><strong>Figura 3    <br> Medida mensual de intervenciones municipales operativas en Cartagena. 1992-1996
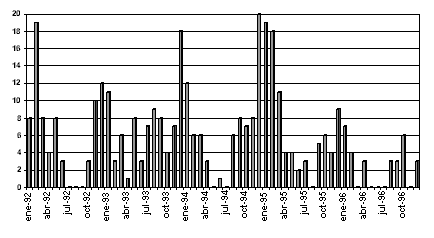
</strong></font></p>      <p ALIGN="center"><!-- big --><!-- big --><img src="/img/fbpe/resp/v73n2/cartg3.gif" alt="cartg3.gif (5293 bytes)"><!-- /big --><!-- /big --></p>      
<p><a name="tab2"></a>&nbsp;&nbsp; <b></p>      <p ALIGN="CENTER"><font size="3">Tabla 2    <br> Estadísticos descriptivos de los indicadores diarios de defunciones, meteorología, gripe y contaminantes atmosféricos en la ciudad de Cartagena, 1992-1996.</font></p> </b>    <div align="center">    ]]></body>
<body><![CDATA[<center>  <table BORDER="0" CELLSPACING="1" bgcolor="#ECECEC">   <tr>     <td VALIGN="top" bgcolor="#C0C0C0">&nbsp; </td>     <td VALIGN="top" COLSPAN="6" bgcolor="#C0C0C0"><i>    <p ALIGN="CENTER"><font size="3">Período     anual</font></i></td>     <td VALIGN="top" COLSPAN="2" bgcolor="#C0C0C0"><i>    <p ALIGN="CENTER"><font size="3">Semestre     cálido</font></i></td>     <td VALIGN="top" bgcolor="#C0C0C0"><i>    <p ALIGN="CENTER"><font size="3">Semestre frío</font></i></td>   </tr>   <tr>     <td VALIGN="top" bgcolor="#C0C0C0">&nbsp; </td>     <td VALIGN="top" bgcolor="#C0C0C0"><i>    <p ALIGN="RIGHT"><font size="3">Media</font></i></td>     <td VALIGN="top" bgcolor="#C0C0C0"><i>    <p ALIGN="RIGHT"><font size="3">Valor mínimo</font></i></td>     <td VALIGN="top" bgcolor="#C0C0C0"><i>    <p ALIGN="RIGHT"><font size="3">Valor máximo</font></i></td>     <td VALIGN="top" bgcolor="#C0C0C0"><i>    <p ALIGN="RIGHT"><font size="3">Percentil 10</font></i></td>     <td VALIGN="top" bgcolor="#C0C0C0"><i>    <p ALIGN="RIGHT"><font size="3">Percentil 90</font></i></td>     <td VALIGN="top" COLSPAN="2" bgcolor="#C0C0C0"><i>    <p ALIGN="RIGHT"><font size="3">Media</font></i></td>     <td VALIGN="top" COLSPAN="2" bgcolor="#C0C0C0"><i>    ]]></body>
<body><![CDATA[<p ALIGN="RIGHT"><font size="3">Media</font></i></td>   </tr>   <tr>     <td VALIGN="top"><font size="3"><i>Defunciones totales sin accidentes</i></font></td>     <td VALIGN="top">    <p ALIGN="RIGHT"><font size="3">3,5</font></td>     <td VALIGN="top">    <p ALIGN="RIGHT"><font size="3">0</font></td>     <td VALIGN="top">    <p ALIGN="RIGHT"><font size="3">13</font></td>     <td VALIGN="top">    <p ALIGN="RIGHT"><font size="3">1</font></td>     <td VALIGN="top">    <p ALIGN="RIGHT"><font size="3">6</font></td>     <td VALIGN="top" COLSPAN="2">    <p ALIGN="RIGHT"><font size="3">3,2</font></td>     <td VALIGN="top" COLSPAN="2">    <p ALIGN="RIGHT"><font size="3">3,7</font></td>   </tr>   <tr>     <td VALIGN="top"><font size="3"><i>Defunciones totales sin accidentes en ³ 70 años de     edad</i></font></td>     <td VALIGN="top">    <p ALIGN="RIGHT"><font size="3">2,4</font></td>     <td VALIGN="top">    <p ALIGN="RIGHT"><font size="3">0</font></td>     <td VALIGN="top">    ]]></body>
<body><![CDATA[<p ALIGN="RIGHT"><font size="3">10</font></td>     <td VALIGN="top">    <p ALIGN="RIGHT"><font size="3">1</font></td>     <td VALIGN="top">    <p ALIGN="RIGHT"><font size="3">5</font></td>     <td VALIGN="top" COLSPAN="2">    <p ALIGN="RIGHT"><font size="3">2,3</font></td>     <td VALIGN="top" COLSPAN="2">    <p ALIGN="RIGHT"><font size="3">2,6</font></td>   </tr>   <tr>     <td VALIGN="top"><font size="3"><i>Defunciones cardiovasculares</i></font></td>     <td VALIGN="top">    <p ALIGN="RIGHT"><font size="3">1,4</font></td>     <td VALIGN="top">    <p ALIGN="RIGHT"><font size="3">0</font></td>     <td VALIGN="top">    <p ALIGN="RIGHT"><font size="3">7</font></td>     <td VALIGN="top">    <p ALIGN="RIGHT"><font size="3">0</font></td>     <td VALIGN="top">    <p ALIGN="RIGHT"><font size="3">3</font></td>     <td VALIGN="top" COLSPAN="2">    ]]></body>
<body><![CDATA[<p ALIGN="RIGHT"><font size="3">1,2</font></td>     <td VALIGN="top" COLSPAN="2">    <p ALIGN="RIGHT"><font size="3">0,4</font></td>   </tr>   <tr>     <td VALIGN="top"><font size="3"><i>Defunciones respiratorias</i></font></td>     <td VALIGN="top">    <p ALIGN="RIGHT"><font size="3">0,4</font></td>     <td VALIGN="top">    <p ALIGN="RIGHT"><font size="3">0</font></td>     <td VALIGN="top">    <p ALIGN="RIGHT"><font size="3">4</font></td>     <td VALIGN="top">    <p ALIGN="RIGHT"><font size="3">0</font></td>     <td VALIGN="top">    <p ALIGN="RIGHT"><font size="3">1</font></td>     <td VALIGN="top" COLSPAN="2">    <p ALIGN="RIGHT"><font size="3">0,3</font></td>     <td VALIGN="top" COLSPAN="2">    <p ALIGN="RIGHT"><font size="3">0,4</font></td>   </tr>   <tr>     <td VALIGN="top"><font size="3"><i>Temperatura media (ºC)</i></font></td>     <td VALIGN="top">    <p ALIGN="RIGHT"><font size="3">19,1</font></td>     <td VALIGN="top">    ]]></body>
<body><![CDATA[<p ALIGN="RIGHT"><font size="3">7,2</font></td>     <td VALIGN="top">    <p ALIGN="RIGHT"><font size="3">30,8</font></td>     <td VALIGN="top">    <p ALIGN="RIGHT"><font size="3">12,4</font></td>     <td VALIGN="top">    <p ALIGN="RIGHT"><font size="3">26,5</font></td>     <td VALIGN="top" COLSPAN="2">    <p ALIGN="RIGHT"><font size="3">23,2</font></td>     <td VALIGN="top" COLSPAN="2">    <p ALIGN="RIGHT"><font size="3">14,9</font></td>   </tr>   <tr>     <td VALIGN="top"><font size="3"><i>Humedad relativa (%)</i></font></td>     <td VALIGN="top">    <p ALIGN="RIGHT"><font size="3">75,2</font></td>     <td VALIGN="top">    <p ALIGN="RIGHT"><font size="3">18,0</font></td>     <td VALIGN="top">    <p ALIGN="RIGHT"><font size="3">95,0</font></td>     <td VALIGN="top">    <p ALIGN="RIGHT"><font size="3">58,0</font></td>     <td VALIGN="top">    ]]></body>
<body><![CDATA[<p ALIGN="RIGHT"><font size="3">90,0</font></td>     <td VALIGN="top" COLSPAN="2">    <p ALIGN="RIGHT"><font size="3">75,5</font></td>     <td VALIGN="top" COLSPAN="2">    <p ALIGN="RIGHT"><font size="3">75,0</font></td>   </tr>   <tr>     <td VALIGN="top"><font size="3"><i>Gripe (casos incidentes)</i></font></td>     <td VALIGN="top">    <p ALIGN="RIGHT"><font size="3">27,3</font></td>     <td VALIGN="top">    <p ALIGN="RIGHT"><font size="3">0</font></td>     <td VALIGN="top">    <p ALIGN="RIGHT"><font size="3">202</font></td>     <td VALIGN="top">    <p ALIGN="RIGHT"><font size="3">1</font></td>     <td VALIGN="top">    <p ALIGN="RIGHT"><font size="3">90</font></td>     <td VALIGN="top" COLSPAN="2">    <p ALIGN="RIGHT"><font size="3">6,2</font></td>     <td VALIGN="top" COLSPAN="2">    <p ALIGN="RIGHT"><font size="3">48,7</font></td>   </tr>   <tr>     <td VALIGN="top"><font size="3"><i>SO2 valor máximo horario(m </i>g/m<sup>3</sup>) </font></td>     <td VALIGN="top">    ]]></body>
<body><![CDATA[<p ALIGN="RIGHT"><font size="3">113,20</font></td>     <td VALIGN="top">    <p ALIGN="RIGHT"><font size="3">18,46</font></td>     <td VALIGN="top">    <p ALIGN="RIGHT"><font size="3">208,38</font></td>     <td VALIGN="top">    <p ALIGN="RIGHT"><font size="3">44,70</font></td>     <td VALIGN="top">    <p ALIGN="RIGHT"><font size="3">208,38</font></td>     <td VALIGN="top" COLSPAN="2">    <p ALIGN="RIGHT"><font size="3">102,58</font></td>     <td VALIGN="top" COLSPAN="2">    <p ALIGN="RIGHT"><font size="3">124,11</font></td>   </tr>   <tr>     <td VALIGN="top"><font size="3"><i>SO2 promedio (m </i>g/m<sup>3</sup>)</font></td>     <td VALIGN="top">    <p ALIGN="RIGHT"><font size="3">43,85</font></td>     <td VALIGN="top">    <p ALIGN="RIGHT"><font size="3">12,71</font></td>     <td VALIGN="top">    <p ALIGN="RIGHT"><font size="3">235,70</font></td>     <td VALIGN="top">    ]]></body>
<body><![CDATA[<p ALIGN="RIGHT"><font size="3">26,10</font></td>     <td VALIGN="top">    <p ALIGN="RIGHT"><font size="3">63,96</font></td>     <td VALIGN="top" COLSPAN="2">    <p ALIGN="RIGHT"><font size="3">41,34</font></td>     <td VALIGN="top" COLSPAN="2">    <p ALIGN="RIGHT"><font size="3">46,44</font></td>   </tr>   <tr>     <td VALIGN="top"><font size="3"><i>Partículas valor máximo horario (m </i>g/m<sup>3</sup>)</font></td>     <td VALIGN="top">    <p ALIGN="RIGHT"><font size="3">178,42</font></td>     <td VALIGN="top">    <p ALIGN="RIGHT"><font size="3">27,56</font></td>     <td VALIGN="top">    <p ALIGN="RIGHT"><font size="3">689,00</font></td>     <td VALIGN="top">    <p ALIGN="RIGHT"><font size="3">72,51</font></td>     <td VALIGN="top">    <p ALIGN="RIGHT"><font size="3">331,63</font></td>     <td VALIGN="top" COLSPAN="2">    <p ALIGN="RIGHT"><font size="3">157,68</font></td>     <td VALIGN="top" COLSPAN="2">    ]]></body>
<body><![CDATA[<p ALIGN="RIGHT"><font size="3">199,70</font></td>   </tr>   <tr>     <td VALIGN="top"><font size="3"><i>Partículas promedio horario (m </i>g/m<sup>3</sup>)</font></td>     <td VALIGN="top">    <p ALIGN="RIGHT"><font size="3">55,89</font></td>     <td VALIGN="top">    <p ALIGN="RIGHT"><font size="3">12,23</font></td>     <td VALIGN="top">    <p ALIGN="RIGHT"><font size="3">226,96</font></td>     <td VALIGN="top">    <p ALIGN="RIGHT"><font size="3">31,45</font></td>     <td VALIGN="top">    <p ALIGN="RIGHT"><font size="3">85,63</font></td>     <td VALIGN="top" COLSPAN="2">    <p ALIGN="RIGHT"><font size="3">52,36</font></td>     <td VALIGN="top" COLSPAN="2">    <p ALIGN="RIGHT"><font size="3">59,52</font></td>   </tr>   <tr>     <td VALIGN="top" colspan="10"><font size="3">El semestre cálido comprende los meses de     mayo a octubre    <br>     El semestre frío comprende los meses de noviembre a abril</font></td>   </tr> </table> </center></div>      <p><a name="tab3"></a>&nbsp;&nbsp; <b></p>      ]]></body>
<body><![CDATA[<p ALIGN="CENTER"><font size="3">Tabla 3    <br> Correlaciones<sup>&amp;</sup> entre valores promedio diarios de los contaminantes atmosféricos, de la temperatura y la humedad relativa en las 3 estaciones captadoras, en la ciudad de Cartagena, 1992-1996.</font></p> </b>    <div align="center">    <center>  <table BORDER="0" CELLSPACING="1" bgcolor="#ECECEC">   <tr>     <td VALIGN="top" bgcolor="#C0C0C0">&nbsp; </td>     <td VALIGN="top" bgcolor="#C0C0C0"><i>    <p ALIGN="CENTER"><font size="3">Temperatura</font></i></td>     <td VALIGN="top" bgcolor="#C0C0C0"><i>    <p ALIGN="CENTER"><font size="3">Humedad</font></i></td>     <td VALIGN="top" bgcolor="#C0C0C0"><i>    <p ALIGN="CENTER"><font size="3">SO<sub>2</sub>     valor máximo</font></i></td>     <td VALIGN="top" bgcolor="#C0C0C0"><i>    <p ALIGN="CENTER"><font size="3">SO<sub>2</sub>     promedio</font></i></td>     <td VALIGN="top" bgcolor="#C0C0C0"><i>    <p ALIGN="CENTER"><font size="3">Partículas valor     máximo</font></i></td>     <td VALIGN="top" bgcolor="#C0C0C0"><font size="3"><i>Partículas promedio</i></font></td>   </tr>   <tr>     <td VALIGN="top"><font size="3"><i>Temperatura<sup>&#134;</sup></i></font></td>     <td VALIGN="top">    <p ALIGN="RIGHT"><font size="3">1,00</font></td>     <td VALIGN="top">    ]]></body>
<body><![CDATA[<p ALIGN="RIGHT"><font size="3">-0,11*</font></td>     <td VALIGN="top">    <p ALIGN="RIGHT"><font size="3">-0,23*</font></td>     <td VALIGN="top">    <p ALIGN="RIGHT"><font size="3">-0,18*</font></td>     <td VALIGN="top">    <p ALIGN="RIGHT"><font size="3">-0,16*</font></td>     <td VALIGN="top">    <p ALIGN="RIGHT"><font size="3">-0,05*</font></td>   </tr>   <tr>     <td VALIGN="top"><font size="3"><i>Humedad relativa<sup>&#135;</sup></i></font></td>     <td VALIGN="top"><!-- big -->&nbsp; <!-- /big --></td>     <td VALIGN="top">    <p ALIGN="RIGHT"><font size="3">1,00</font></td>     <td VALIGN="top">    <p ALIGN="RIGHT"><font size="3">0,06*</font></td>     <td VALIGN="top">    <p ALIGN="RIGHT"><font size="3">-0,02</font></td>     <td VALIGN="top">    <p ALIGN="RIGHT"><font size="3">-0,08*</font></td>     <td VALIGN="top">    <p ALIGN="RIGHT"><font size="3">0,07*</font></td>   </tr>   <tr>     <td VALIGN="top"><font size="3"><i>SO<sub>2</sub> valor máximo</i></font></td>     <td VALIGN="top"><!-- big -->&nbsp; <!-- /big --></td>     <td VALIGN="top">&nbsp; </td>     <td VALIGN="top">    ]]></body>
<body><![CDATA[<p ALIGN="RIGHT"><font size="3">1,00</font></td>     <td VALIGN="top">    <p ALIGN="RIGHT"><font size="3">0,81*</font></td>     <td VALIGN="top">    <p ALIGN="RIGHT"><font size="3">0,23*</font></td>     <td VALIGN="top">    <p ALIGN="RIGHT"><font size="3">0,25</font></td>   </tr>   <tr>     <td VALIGN="top"><font size="3"><i>SO<sub>2</sub> promedio</i></font></td>     <td VALIGN="top"><!-- big -->&nbsp; <!-- /big --></td>     <td VALIGN="top">&nbsp; </td>     <td VALIGN="top">&nbsp; </td>     <td VALIGN="top">    <p ALIGN="RIGHT"><font size="3">1,00</font></td>     <td VALIGN="top">    <p ALIGN="RIGHT"><font size="3">0,17*</font></td>     <td VALIGN="top">    <p ALIGN="RIGHT"><font size="3">0,20*</font></td>   </tr>   <tr>     <td VALIGN="top"><font size="3"><i>Partículas valor máximo</i></font></td>     <td VALIGN="top"><!-- big -->&nbsp; <!-- /big --></td>     <td VALIGN="top">&nbsp; </td>     <td VALIGN="top">&nbsp; </td>     <td VALIGN="top">&nbsp; </td>     <td VALIGN="top">    <p ALIGN="RIGHT"><font size="3">1,00</font></td>     <td VALIGN="top">    <p ALIGN="RIGHT"><font size="3">0,82*</font></td>   </tr>   <tr>     <td VALIGN="top"><font size="3"><i>Partículas promedio</i></font></td>     <td VALIGN="top"><!-- big -->&nbsp; <!-- /big --></td>     <td VALIGN="top">&nbsp; </td>     <td VALIGN="top">&nbsp; </td>     <td VALIGN="top">&nbsp; </td>     <td VALIGN="top">&nbsp;&nbsp;&nbsp; </td>     <td VALIGN="top">    <p ALIGN="RIGHT"><font size="3">1,00 </font></td>   </tr>   <tr>     <td VALIGN="top" colspan="7"><font size="3">(&#134;) Temperatura promedio de la máxima y     mínima horaria diaria    ]]></body>
<body><![CDATA[<br>     (&#135;) Humedad relativa promedio de los registros a las 7, 13 y 18 horas    <br>     (&amp; ) Coeficientes de correlación de Spearman    <br>     (*) La correlación es estadísticamente significativa con p£ 0,05 (bilateral)</font></td>   </tr> </table> </center></div>      <p ALIGN="JUSTIFY">&nbsp;</p>      <p ALIGN="JUSTIFY"><font size="3">Al analizar todo el periodo desde 1992 a 1996, no se observaron asociaciones estadísticamente significativas entre las causas de defunción y los contaminantes atmosféricos estudiados (<a href="#tab4">tabla 4</a>). En todo el período, los modelos que mejor prueban la asociación entre contaminación y defunciones incluyen como máximo dos días después (retardo), excepto en la mortalidad por causa cardiovascular, que en su mayoría es el tercer día después.</font></p>      <p ALIGN="JUSTIFY"><a name="tab4"></a>&nbsp;&nbsp; </p> <b>      <p ALIGN="CENTER"><font size="3">Tabla 4    <br> Asociación* entre contaminantes atmosféricos y causas de defunción en <u>todo el período</u> en la ciudad de    <br> Cartagena, 1992-1996.</font></b></p>     <div align="center">    ]]></body>
<body><![CDATA[<center>  <table BORDER="0" CELLSPACING="1" bgcolor="#ECECEC">   <tr>     <td VALIGN="top" bgcolor="#C0C0C0">&nbsp; </td>     <td VALIGN="top" COLSPAN="2" bgcolor="#C0C0C0"><font size="3"><i>Defunciones totales sin     accidentes</i></font></td>     <td VALIGN="top" COLSPAN="2" bgcolor="#C0C0C0"><font size="3"><i>Defunciones totales sin     accidentes en ³ 70 años</i></font></td>     <td VALIGN="top" COLSPAN="2" bgcolor="#C0C0C0"><font size="3"><i>Defunciones por     enfermedades cardiocirculatorias</i></font></td>     <td VALIGN="top" COLSPAN="2" bgcolor="#C0C0C0"><font size="3"><i>Defunciones por     enfermedades respiratorias</i></font></td>   </tr>   <tr>     <td VALIGN="top">&nbsp;&nbsp;&nbsp;&nbsp; </td>     <td VALIGN="top"><font size="3">Ret</font></td>     <td VALIGN="top"><font size="3">RR (IC 95%)</font></td>     <td VALIGN="top"><font size="3">Ret</font></td>     <td VALIGN="top"><font size="3">RR (IC 95%)</font></td>     <td VALIGN="top"><font size="3">Ret</font></td>     <td VALIGN="top"><font size="3">RR (IC 95%)</font></td>     <td VALIGN="top"><font size="3">Ret</font></td>     <td VALIGN="top"><font size="3">RR (IC 95%)</font></td>   </tr>   <tr>     <td VALIGN="top"><font size="3"><i>SO<sub>2</sub> valor máximo</i></font></td>     <td VALIGN="top"><font size="3">1</font></td>     <td VALIGN="top"><font size="3">0,9999;     <br>     0,9996 a 1,0002</font></td>     <td VALIGN="top"><font size="3">1</font></td>     <td VALIGN="top"><font size="3">0,9998;     <br>     0,9994 a 1,000</font></td>     <td VALIGN="top"><font size="3">3</font></td>     <td VALIGN="top"><font size="3">1.000;     <br>     0,9997 a 1.001</font></td>     <td VALIGN="top"><font size="3">2</font></td>     <td VALIGN="top"><font size="3">0,9997;    <br>     0,998 a 1.001</font></td>   </tr>   <tr>     <td VALIGN="top"><font size="3"><i>SO<sub>2</sub>    <br>     promedio</i></font></td>     <td VALIGN="top"><font size="3">2</font></td>     <td VALIGN="top"><font size="3">0,999;     <br>     0,998 a 1,001</font></td>     <td VALIGN="top"><font size="3">1</font></td>     <td VALIGN="top"><font size="3">0,9988;     <br>     0,9970 a 1.000</font></td>     <td VALIGN="top"><font size="3">2</font></td>     <td VALIGN="top"><font size="3">0,9984;     <br>     0,9962 a 1.001</font></td>     <td VALIGN="top"><font size="3">1</font></td>     <td VALIGN="top"><font size="3">0,9973; 0,9938 a 1.002</font></td>   </tr>   <tr>     <td VALIGN="top"><font size="3"><i>Partículas valor máximo</i></font></td>     <td VALIGN="top"><font size="3">2</font></td>     <td VALIGN="top"><font size="3">0,9998;     <br>     0,9995 a 1,0000</font></td>     <td VALIGN="top"><font size="3">2</font></td>     <td VALIGN="top"><font size="3">0,9987;     ]]></body>
<body><![CDATA[<br>     0,9974 a 1.000</font></td>     <td VALIGN="top"><font size="3">3</font></td>     <td VALIGN="top"><font size="3">1,000;     <br>     1,000 a 1,001</font></td>     <td VALIGN="top"><font size="3">2</font></td>     <td VALIGN="top"><font size="3">0,9996;     <br>     0,9998 a 1.000</font></td>   </tr>   <tr>     <td VALIGN="top"><font size="3"><i>Partículas promedio</i></font></td>     <td VALIGN="top"><font size="3">2</font></td>     <td VALIGN="top"><font size="3">0,9991;     <br>     0.9980 a 1.000</font></td>     <td VALIGN="top"><font size="3">2</font></td>     <td VALIGN="top"><font size="3">0,9987;     <br>     0,9974 a 1.000</font></td>     <td VALIGN="top"><font size="3">3</font></td>     <td VALIGN="top"><font size="3">1.001;     <br>     0,9998 a 1,003</font></td>     <td VALIGN="top"><font size="3">0</font></td>     <td VALIGN="top"><font size="3">1.002;     <br>     0,999 a 1.006</font></td>   </tr>   <tr>     <td VALIGN="top" colspan="9">(*) Riesgo relativo e intervalo de confianza al 95% ajustado     por estacionalidad, meteorología y gripe, para un incremento de nivel del contaminante     atmosférico de 10 m g/m<sup>3</sup> Ret = retardo </td>   </tr> </table> </center></div>      <p ALIGN="JUSTIFY">&nbsp;</p>      <p ALIGN="JUSTIFY"><font size="3">En los resultados por semestres se evidenciaron asociaciones estadísticamente significativas negativas entre el valor máximo de las partículas y las defunciones totales sin accidentes en personas de 70 y más años, y de signo positivo con el promedio de las partículas y las defunciones cardiovasculares del mes de mayo a octubre (<a href="#tab5">tabla 5</a>). Los modelos que mejor describen la relación contaminante/mortalidad llegan hasta el cuarto día para la manifestación del fallecimiento. La asociación positiva se da en el mismo día (retardo 0 en la tabla).</font></p>      <p ALIGN="JUSTIFY"><a name="tab5"></a>&nbsp;&nbsp; </p> <b>      ]]></body>
<body><![CDATA[<p ALIGN="CENTER"><font size="3">Tabla 5    <br> Asociación* entre contaminantes químicos atmosféricos y causas de defunción en los <u>semestres cálido</u> y <u>frío</u> en la ciudad de Cartagena, 1992-1996.</font></p> </b>    <div align="center">    <center>  <table BORDER="0" CELLSPACING="1" bgcolor="#ECECEC">   <tr>     <td VALIGN="top" bgcolor="#C0C0C0">&nbsp; </td>     <td VALIGN="top" COLSPAN="2" bgcolor="#C0C0C0"><font size="3"><i>Defunciones totales sin     accidentes</i></font></td>     <td VALIGN="top" COLSPAN="2" bgcolor="#C0C0C0"><font size="3"><i>Defunciones totales sin     accidentes en ³ 70 años</i></font></td>     <td VALIGN="top" COLSPAN="2" bgcolor="#C0C0C0"><font size="3"><i>Defunciones por     enfermedades cardiocirculatorias</i></font></td>     <td VALIGN="top" COLSPAN="2" bgcolor="#C0C0C0"><font size="3"><i>Defunciones por     enfermedades respiratorias</i></font></td>   </tr>   <tr>     <td VALIGN="top" colspan="9"><font size="3"><b>Semestre cálido</b></font></td>   </tr>   <tr>     <td VALIGN="top">&nbsp; </td>     <td VALIGN="top"><font size="3">Ret.</font></td>     <td VALIGN="top"><font size="3">RR (IC 95%)</font></td>     <td VALIGN="top"><font size="3">Ret</font></td>     <td VALIGN="top"><font size="3">RR (IC 95%)</font></td>     <td VALIGN="top"><font size="3">Ret</font></td>     <td VALIGN="top"><font size="3">RR (IC 95%)</font></td>     <td VALIGN="top"><font size="3">Ret</font></td>     <td VALIGN="top"><font size="3">RR (IC 95%)</font></td>   </tr>   <tr>     <td VALIGN="top"><font size="3"><i>SO<sub>2</sub> valor máximo</i></font></td>     <td VALIGN="top"><font size="3">2</font></td>     <td VALIGN="top"><font size="3">0,997(0,991-1,002)</font></td>     <td VALIGN="top"><font size="3">2</font></td>     <td VALIGN="top"><font size="3">0,979(0,951-1,006)</font></td>     <td VALIGN="top"><font size="3">0</font></td>     <td VALIGN="top"><font size="3">0,994(0,973-1,015)</font></td>     <td VALIGN="top"><font size="3">4</font></td>     <td VALIGN="top"><font size="3">1,003(0,999-1,007)</font></td>   </tr>   <tr>     <td VALIGN="top"><font size="3"><i>SO<sub>2</sub> promedio</i></font></td>     <td VALIGN="top"><font size="3">4</font></td>     <td VALIGN="top"><font size="3">1,006(0,999-1,012)</font></td>     <td VALIGN="top"><font size="3">2</font></td>     <td VALIGN="top"><font size="3">0,972(0,941-1,005)</font></td>     <td VALIGN="top"><font size="3">2</font></td>     <td VALIGN="top"><font size="3">0,979(0,955-1,004)</font></td>     <td VALIGN="top"><font size="3">2</font></td>     <td VALIGN="top"><font size="3">0,996(0,991-1,001)</font></td>   </tr>   <tr>     <td VALIGN="top"><font size="3"><i>Partículas valor máximo</i></font></td>     <td VALIGN="top"><font size="3">3</font></td>     <td VALIGN="top"><font size="3">1,005(0,996-1,013)</font></td>     <td VALIGN="top"><font size="3"><b>2**</b></font></td>     <td VALIGN="top"><font size="3"><b>0,977(0,972-0,981)</b></font></td>     <td VALIGN="top"><font size="3">3 </font></td>     <td VALIGN="top"><font size="3">1,015(0,983-1,048)</font></td>     <td VALIGN="top"><font size="3">3</font></td>     <td VALIGN="top"><font size="3">1,004(0,998-1,011)</font></td>   </tr>   <tr>     <td VALIGN="top"><font size="3"><i>Partículas valor promedio</i></font></td>     <td VALIGN="top"><font size="3">1</font></td>     <td VALIGN="top"><font size="3">0,993(0,975-1,011)</font></td>     <td VALIGN="top"><font size="3">1</font></td>     <td VALIGN="top"><font size="3">0,945(0,864-1,033)</font></td>     <td VALIGN="top"><font size="3"><b>0</b></font></td>     <td VALIGN="top"><font size="3"><b>1,072(1,008-1,140)</b></font></td>     <td VALIGN="top"><font size="3">2</font></td>     <td VALIGN="top"><font size="3">0,990(0,976-1,003)</font></td>   </tr>   <tr>     <td VALIGN="top" colspan="9"><font size="3"><b>Semestre frío</b></font></td>   </tr>   <tr>     <td VALIGN="top"><font size="3"><i>SO<sub>2</sub> valor máximo</i></font></td>     <td VALIGN="top"><font size="3">3</font></td>     <td VALIGN="top"><font size="3">1,001(0,997-1,005)</font></td>     <td VALIGN="top"><font size="3">3</font></td>     <td VALIGN="top"><font size="3">1,002(0,986-1,019)</font></td>     <td VALIGN="top"><font size="3">3</font></td>     <td VALIGN="top"><font size="3">1,011(0,998-1,024)</font></td>     <td VALIGN="top"><font size="3">1</font></td>     <td VALIGN="top"><font size="3">0,997(0,994-1,000)</font></td>   </tr>   <tr>     <td VALIGN="top"><font size="3"><i>SO<sub>2</sub> promedio</i></font></td>     <td VALIGN="top"><font size="3">1</font></td>     <td VALIGN="top"><font size="3">0,997(0,992-1,002)</font></td>     <td VALIGN="top"><font size="3">1</font></td>     <td VALIGN="top"><font size="3">0,986(0,965-1,007)</font></td>     <td VALIGN="top"><font size="3">3</font></td>     <td VALIGN="top"><font size="3">1,014(0,998-1,029)</font></td>     <td VALIGN="top"><font size="3">3</font></td>     <td VALIGN="top"><font size="3">1,003(0,999-1,006)</font></td>   </tr>   <tr>     <td VALIGN="top"><font size="3"><i>Partículas valor máximo</i></font></td>     <td VALIGN="top"><font size="3">4</font></td>     <td VALIGN="top"><font size="3">1,003(0,997-1,009)</font></td>     <td VALIGN="top"><font size="3">2</font></td>     <td VALIGN="top"><font size="3">0,983(0,955-1,012)</font></td>     <td VALIGN="top"><font size="3"><b>3**</b></font></td>     <td VALIGN="top"><font size="3"><b>1,021(1,001-1,042)</b></font></td>     <td VALIGN="top"><font size="3"><b>3**</b></font></td>     <td VALIGN="top"><font size="3"><b>1,006(1,002-1,011)</b></font></td>   </tr>   <tr>     <td VALIGN="top"><font size="3"><i>Partículas valor promedio</i></font></td>     <td VALIGN="top"><font size="3">5</font></td>     <td VALIGN="top"><font size="3">0,995(0,981-1,009)</font></td>     <td VALIGN="top"><font size="3">4</font></td>     <td VALIGN="top"><font size="3">0,976(0,922-1,033)</font></td>     <td VALIGN="top"><font size="3">3</font></td>     <td VALIGN="top"><font size="3">1,021(0,981-1,064)</font></td>     <td VALIGN="top"><font size="3">0</font></td>     <td VALIGN="top"><font size="3">1,006(0,996-1,015)</font></td>   </tr>   <tr>     <td VALIGN="top" colspan="9"><font size="3">(*) Riesgo relativo e intervalo de confianza     al 95% ajustado por estacionalidad, meteorología y gripe, para un incremento de nivel del     contaminante atmosférico de 10 m g/m<sup>3</sup>     <br>     Semestre cálido incluye los meses de mayo a octubre y el frío de noviembre a abril Ret =     retardo en días. (**) El modelo de parametrización no es consistente</font></td>   </tr> </table> </center></div>      <p ALIGN="JUSTIFY">&nbsp;</p>      <p ALIGN="JUSTIFY"><font size="3">En el semestre frío, encontramos relación estadísticamente significativa y positiva en el valor máximo horario de las partículas y las muertes por entidades cardiocirculatorias y respiratorias, al tercer día del fallecimiento (<a href="#tab5">tabla 5</a>).</font></p>      <p ALIGN="JUSTIFY"><font size="3">Cabría la posibilidad de hallar el RR para la diferencia entre los percentiles 90 y 10, pero estos valores van a estar influenciados por el Plan de Intervención, por lo que sería poco usual días de intervención con mediciones altas de contaminación, dejando de ser un fenómeno aleatorio. Por ello se decidió la utilización del RR en unidades naturales de los contaminantes.</font></p>      <p ALIGN="JUSTIFY"><font size="3">Al evaluar la fiabilidad de los modelos con riesgos relativos estadísticamente significativos, observamos que los modelos incluyen variables distintas, y que los coeficientes de regresión para el mismo contaminante presentan magnitudes y niveles de significación diferentes (<a href="#tab6">tabla 6</a>). </font></p>      <p ALIGN="JUSTIFY"><a name="tab6"></a>&nbsp;&nbsp; </p> <b>      ]]></body>
<body><![CDATA[<p ALIGN="CENTER"><font size="3">Tabla 6    <br> Fiabilidad de los modelos con asociaciones estadísticamente significativas entre contaminación atmosférica y tipos de defunciones. EMECAM-Cartagena, 1992-96.</font></p> </b>    <div align="center">    <center>  <table BORDER="0" CELLSPACING="1" bgcolor="#ECECEC">   <tr>     <td VALIGN="top" bgcolor="#C0C0C0">&nbsp; </td>     <td VALIGN="top" bgcolor="#C0C0C0"><i>    <p ALIGN="CENTER"><font size="3">Modelo con el     contaminante al inicio (modelo 1)</font></i></td>     <td VALIGN="top" bgcolor="#C0C0C0"><i>    <p ALIGN="CENTER"><font size="3">Modelo con el     contaminante al final (modelo 2)</font></i></td>     <td VALIGN="top" COLSPAN="2" bgcolor="#C0C0C0"><i>    <p ALIGN="CENTER"><font size="3">Variables     distintas entre los modelos</font></i></td>   </tr>   <tr>     <td VALIGN="top" bgcolor="#C0C0C0">&nbsp; </td>     <td VALIGN="top" bgcolor="#C0C0C0">    <p ALIGN="CENTER"><font size="3">Coef. De regresión     (E.E.)</font></td>     <td VALIGN="top" bgcolor="#C0C0C0">    <p ALIGN="CENTER"><font size="3">Coef. de regresión     (E.E.)</font></td>     <td VALIGN="top" bgcolor="#C0C0C0"><i>    <p ALIGN="CENTER"><font size="3">Modelo con el     contaminante al inicio (modelo 1)</font></i></td>     <td VALIGN="top" bgcolor="#C0C0C0"><i>    ]]></body>
<body><![CDATA[<p ALIGN="left"><font size="3">Modelo con el     contaminante    <br>     al final (modelo 2)</font></i></td>   </tr>   <tr>     <td VALIGN="top"><font size="3"><b>Semestre cálido</b></font></td>     <td VALIGN="top"><!-- big -->&nbsp; <!-- /big --></td>     <td VALIGN="top"><!-- big -->&nbsp; <!-- /big --></td>     <td VALIGN="top"><!-- big -->&nbsp; <!-- /big --></td>     <td VALIGN="top"><!-- big -->&nbsp; <!-- /big --></td>   </tr>   <tr>     <td VALIGN="top"><font size="3"><i>Defunciones totales sin accidentes en ³ 70 años y     valor máximo en Partículas*</i></font></td>     <td VALIGN="top">    <p ALIGN="JUSTIFY"><font size="3">-0,4038E-03 (0,251E-03)</font></td>     <td VALIGN="top">    <p ALIGN="JUSTIFY"><font size="3">-0,5469E-03 (0,257E-03)</font></td>     <td VALIGN="top">    <p ALIGN="JUSTIFY"><font size="3">retardos 2 y 7 de temperatura y 2 de     temperatura<sup>2</sup></font></td>     <td VALIGN="top">    <p ALIGN="JUSTIFY"><font size="3">retardo 6 de humedad y día de la     semana e intervención municipal sobre la contaminación</font></td>   </tr>   <tr>     <td VALIGN="top" colspan="5">&nbsp; </td>   </tr>   <tr>     <td VALIGN="top"><font size="3"><i>Defunciones cardiovasculares y valor promedio en     Partículas*</i></font></td>     <td VALIGN="top">    <p ALIGN="JUSTIFY"><font size="3">0,1473E-02 (0,165E-02)</font></td>     <td VALIGN="top">    <p ALIGN="JUSTIFY"><font size="3">0,1742E-02 (0,165E-02)</font></td>     <td VALIGN="top">    <p ALIGN="JUSTIFY"><font size="3">retardo 6 de humedad</font></td>     <td VALIGN="top"><font size="3">eventos especiales</font></td>   </tr>   <tr>     <td VALIGN="top"><font size="3"><b>Semestre frío</b></font></td>     <td VALIGN="top">&nbsp; </td>     <td VALIGN="top">&nbsp; </td>     <td VALIGN="top">&nbsp; </td>     <td VALIGN="top">&nbsp; </td>   </tr>   <tr>     <td VALIGN="top"><font size="3"><i>Defunciones cardiovasculares y el valor máximo en     Partículas*</i></font></td>     <td VALIGN="top">    <p ALIGN="JUSTIFY"><font size="3">0,6384E-03 (0,233E-03)</font></td>     <td VALIGN="top">    ]]></body>
<body><![CDATA[<p ALIGN="JUSTIFY"><font size="3">0,7671E-03 (0,245E-03)</font></td>     <td VALIGN="top">    <p ALIGN="JUSTIFY"><font size="3">tendencia<sup>2</sup>, retardo 5 de     gripe</font></td>     <td VALIGN="top">    <p ALIGN="JUSTIFY"><font size="3">función sen/coseno2, año de     defunción</font></td>   </tr>   <tr>     <td VALIGN="top" colspan="5">&nbsp;&nbsp; </td>   </tr>   <tr>     <td VALIGN="top"><font size="3"><i>Defunciones respiratorias y el valor máximo en     Partículas*</i></font></td>     <td VALIGN="top">    <p ALIGN="JUSTIFY"><font size="3">0,5524E-03 (0,489E-03)</font></td>     <td VALIGN="top">    <p ALIGN="JUSTIFY"><font size="3">0,4146E-03 (0,489E-03)</font></td>     <td VALIGN="top">    <p ALIGN="JUSTIFY"><font size="3">retardo 10 de gripe</font></td>     <td VALIGN="top">    <p ALIGN="JUSTIFY"><font size="3">retardo 4 de temperatura, tendencia y     tendencia<sup>2</sup></font></td>   </tr>   <tr>     <td VALIGN="top" colspan="5"><font size="3">Coef.=coeficiente     <br>     E.E.= Error estándar    <br>     (*) Modelo con distintas variables y distintas magnitudes y significación estadística de     los coeficiente de regresión para el contaminante </font></td>   </tr> </table> </center></div>      <p ALIGN="JUSTIFY">&nbsp;</p>      ]]></body>
<body><![CDATA[<p ALIGN="JUSTIFY"><font size="3">Los análisis por semestre elaborados con la totalidad de los datos del período que incluyen la interacción contaminante/semestre presentan una composición de variables y resultados distintos frente a los modelos que se construyen sólo con los datos del semestre. No obstante es necesario, como parece lógico, que los resultados obtenidos sean interpretados con gran prudencia.</font></p>      <p ALIGN="JUSTIFY"><font size="3">Podríamos plantear, como líneas de futuro, en primer lugar la ya comentada de conocer el efecto de las intervenciones municipales en el control de la contaminación y, en segundo lugar, el aplicar los mismos modelos con la patología cardiovascular y la morbilidad respiratoria, y a su vez ésta con otra contaminación biológica como son los pólenes. Asimismo, será preciso caracterizar los efectos combinados de la contaminación atmosférica por SO<sub>2</sub> y partículas.</font></p>      <p><b>&nbsp;</p>      <p ALIGN="CENTER"><font size="4">BIBLIOGRAFÍA</font></b></p>      <!-- ref --><p ALIGN="JUSTIFY"><font size="3">1.- Moreno Clavel, J. Repercusiones de la industrialización sobre nuestro ambiente. Cartagena: Escuela Universitaria de Ingeniería Industrial;1971.</font>&nbsp;&nbsp;&nbsp;&nbsp;&nbsp;&nbsp;&nbsp;&nbsp;[&#160;<a href="javascript:void(0);" onclick="javascript: window.open('/scielo.php?script=sci_nlinks&ref=5544696&pid=S1135-5727199900020001100001&lng=','','width=640,height=500,resizable=yes,scrollbars=1,menubar=yes,');">Links</a>&#160;]<!-- end-ref --><!-- ref --><p ALIGN="JUSTIFY"><font size="3">2.- Tormo MJ, Navarro C, Mortalidad general y por causas específicas e incidencia de cáncer en Cartagena y su comparación con la situación en otras áreas geográficas regionales. En: Contaminación atmosférica y salud en Cartagena. Cartagena: Consejería de Sanidad; 1991. Monografías Sanitarias núm 10.</font>&nbsp;&nbsp;&nbsp;&nbsp;&nbsp;&nbsp;&nbsp;&nbsp;[&#160;<a href="javascript:void(0);" onclick="javascript: window.open('/scielo.php?script=sci_nlinks&ref=5544697&pid=S1135-5727199900020001100002&lng=','','width=640,height=500,resizable=yes,scrollbars=1,menubar=yes,');">Links</a>&#160;]<!-- end-ref --><!-- ref --><p ALIGN="JUSTIFY"><font size="3">3.- Guillén Pérez, JJ; Guillén Grima, F; Medrano Tortosa, J; García-Marcos, L; Aguinaga Ontoso, I; Ñiguez Carbonell, JC. Afluencia inusual por asma y enfermedad pulmonar obstructiva crónica en urgencias hospitalarias y contaminación por SO2 en Cartagena. Rev Esp Salud Pública 1995;69:305-314.</font>&nbsp;&nbsp;&nbsp;&nbsp;&nbsp;&nbsp;&nbsp;&nbsp;[&#160;<a href="javascript:void(0);" onclick="javascript: window.open('/scielo.php?script=sci_nlinks&ref=5544698&pid=S1135-5727199900020001100003&lng=','','width=640,height=500,resizable=yes,scrollbars=1,menubar=yes,');">Links</a>&#160;]<!-- end-ref --><!-- ref --><p ALIGN="JUSTIFY"><font size="3">4.- Ballester Díez F, Sáez Zafra M, Alonso Fustel ME, Taracido Trunk M, Ordóñez Iriarte JM, Aguinaga Ontoso I et al. El proyecto EMECAM: Estudio multicéntrico español sobre la relación entre la contaminación atmosférica y la mortalidad. Antecedentes, participantes, objetivos, material y métodos. Rev Esp Salud Púb 1999;165-175.</font>&nbsp;&nbsp;&nbsp;&nbsp;&nbsp;&nbsp;&nbsp;&nbsp;[&#160;<a href="javascript:void(0);" onclick="javascript: window.open('/scielo.php?script=sci_nlinks&ref=5544699&pid=S1135-5727199900020001100004&lng=','','width=640,height=500,resizable=yes,scrollbars=1,menubar=yes,');">Links</a>&#160;]<!-- end-ref --><!-- ref --><p ALIGN="JUSTIFY"><font size="3">5.- Pérez Hoyos S, Sáez Zafra M, Barceló Rado MA, Cambra K, Guillén Grima F, Bellido Blasco J, et al. Protocolo EMECAM: Análisis del efecto a corto plazo de la contaminación atmosférica sobre la mortalidad. Rev Esp Salud Púb 1999; 177-185</font>&nbsp;&nbsp;&nbsp;&nbsp;&nbsp;&nbsp;&nbsp;&nbsp;[&#160;<a href="javascript:void(0);" onclick="javascript: window.open('/scielo.php?script=sci_nlinks&ref=5544700&pid=S1135-5727199900020001100005&lng=','','width=640,height=500,resizable=yes,scrollbars=1,menubar=yes,');">Links</a>&#160;]<!-- end-ref --><!-- ref --><p ALIGN="JUSTIFY"><font size="3">6.- Moreno Clavel J, Moreno J, Moreno Grau S, Jiménez Torres E. Operative plan for pollution control in Cartagena. Spain. En: Moreno Clavel J, Moreno Grau J. Proceedings of the workshop on best available technologies for pollution control.Luxemburgo: OPEUR</font>&nbsp;&nbsp;&nbsp;&nbsp;&nbsp;&nbsp;&nbsp;&nbsp;[&#160;<a href="javascript:void(0);" onclick="javascript: window.open('/scielo.php?script=sci_nlinks&ref=5544701&pid=S1135-5727199900020001100006&lng=','','width=640,height=500,resizable=yes,scrollbars=1,menubar=yes,');">Links</a>&#160;]<!-- end-ref --><!-- ref --><p ALIGN="JUSTIFY"><font size="3">7.- Ferrán Aranaz, M. SPSS para Windows. Programación y Análisis. Madrid: McGraw-Hill; 1996.</font>&nbsp;&nbsp;&nbsp;&nbsp;&nbsp;&nbsp;&nbsp;&nbsp;[&#160;<a href="javascript:void(0);" onclick="javascript: window.open('/scielo.php?script=sci_nlinks&ref=5544702&pid=S1135-5727199900020001100007&lng=','','width=640,height=500,resizable=yes,scrollbars=1,menubar=yes,');">Links</a>&#160;]<!-- end-ref --><!-- ref --><p ALIGN="JUSTIFY"><font size="3">8.- Abraira Santos V, Pérez de Vargas Luque A. Métodos Multivariantes en Bioestadística. Madrid: Centro de Estudios Ramón Areces SA; 1996.</font>&nbsp;&nbsp;&nbsp;&nbsp;&nbsp;&nbsp;&nbsp;&nbsp;[&#160;<a href="javascript:void(0);" onclick="javascript: window.open('/scielo.php?script=sci_nlinks&ref=5544703&pid=S1135-5727199900020001100008&lng=','','width=640,height=500,resizable=yes,scrollbars=1,menubar=yes,');">Links</a>&#160;]<!-- end-ref --> ]]></body><back>
<ref-list>
<ref id="B1">
<label>1</label><nlm-citation citation-type="book">
<person-group person-group-type="author">
<name>
<surname><![CDATA[Moreno Clavel]]></surname>
<given-names><![CDATA[J]]></given-names>
</name>
</person-group>
<source><![CDATA[Repercusiones de la industrialización sobre nuestro ambiente]]></source>
<year>1971</year>
<publisher-loc><![CDATA[Cartagena ]]></publisher-loc>
<publisher-name><![CDATA[Escuela Universitaria de Ingeniería Industrial]]></publisher-name>
</nlm-citation>
</ref>
<ref id="B2">
<label>2</label><nlm-citation citation-type="book">
<person-group person-group-type="author">
<name>
<surname><![CDATA[Tormo]]></surname>
<given-names><![CDATA[MJ]]></given-names>
</name>
<name>
<surname><![CDATA[Navarro]]></surname>
<given-names><![CDATA[C]]></given-names>
</name>
</person-group>
<article-title xml:lang="es"><![CDATA[Mortalidad general y por causas específicas e incidencia de cáncer en Cartagena y su comparación con la situación en otras áreas geográficas regionales]]></article-title>
<source><![CDATA[Contaminación atmosférica y salud en Cartagena]]></source>
<year>1991</year>
<volume>10</volume>
<publisher-loc><![CDATA[Cartagena ]]></publisher-loc>
<publisher-name><![CDATA[Consejería de Sanidad]]></publisher-name>
</nlm-citation>
</ref>
<ref id="B3">
<label>3</label><nlm-citation citation-type="journal">
<person-group person-group-type="author">
<name>
<surname><![CDATA[Guillén Pérez]]></surname>
<given-names><![CDATA[JJ]]></given-names>
</name>
<name>
<surname><![CDATA[Guillén Grima]]></surname>
<given-names><![CDATA[F]]></given-names>
</name>
<name>
<surname><![CDATA[Medrano Tortosa]]></surname>
<given-names><![CDATA[J]]></given-names>
</name>
<name>
<surname><![CDATA[García-Marcos]]></surname>
<given-names><![CDATA[L]]></given-names>
</name>
<name>
<surname><![CDATA[Aguinaga Ontoso]]></surname>
<given-names><![CDATA[I]]></given-names>
</name>
<name>
<surname><![CDATA[Ñiguez Carbonell]]></surname>
<given-names><![CDATA[JC]]></given-names>
</name>
</person-group>
<article-title xml:lang="es"><![CDATA[Afluencia inusual por asma y enfermedad pulmonar obstructiva crónica en urgencias hospitalarias y contaminación por SO2 en Cartagena]]></article-title>
<source><![CDATA[Rev Esp Salud Pública]]></source>
<year>1995</year>
<volume>69</volume>
<page-range>305-314</page-range></nlm-citation>
</ref>
<ref id="B4">
<label>4</label><nlm-citation citation-type="journal">
<person-group person-group-type="author">
<name>
<surname><![CDATA[Ballester Díez]]></surname>
<given-names><![CDATA[F]]></given-names>
</name>
<name>
<surname><![CDATA[Sáez-Zafra]]></surname>
<given-names><![CDATA[M]]></given-names>
</name>
<name>
<surname><![CDATA[Alonso Fustel]]></surname>
<given-names><![CDATA[ME]]></given-names>
</name>
<name>
<surname><![CDATA[Taracido Trunk]]></surname>
<given-names><![CDATA[M]]></given-names>
</name>
<name>
<surname><![CDATA[Ordóñez Iriarte]]></surname>
<given-names><![CDATA[JM]]></given-names>
</name>
<name>
<surname><![CDATA[Aguinaga Ontoso]]></surname>
<given-names><![CDATA[I]]></given-names>
</name>
</person-group>
<article-title xml:lang="es"><![CDATA[El proyecto EMECAM: Estudio multicéntrico español sobre la relación entre la contaminación atmosférica y la mortalidad. Antecedentes, participantes, objetivos, material y métodos]]></article-title>
<source><![CDATA[Rev Esp Salud Púb]]></source>
<year>1999</year>
<page-range>165-175</page-range></nlm-citation>
</ref>
<ref id="B5">
<label>5</label><nlm-citation citation-type="journal">
<person-group person-group-type="author">
<name>
<surname><![CDATA[Pérez Hoyos]]></surname>
<given-names><![CDATA[S]]></given-names>
</name>
<name>
<surname><![CDATA[Sáez Zafra]]></surname>
<given-names><![CDATA[M]]></given-names>
</name>
<name>
<surname><![CDATA[Barceló Rado]]></surname>
<given-names><![CDATA[MA]]></given-names>
</name>
<name>
<surname><![CDATA[Cambra]]></surname>
<given-names><![CDATA[K]]></given-names>
</name>
<name>
<surname><![CDATA[Guillén Grima]]></surname>
<given-names><![CDATA[F]]></given-names>
</name>
<name>
<surname><![CDATA[Bellido Blasco]]></surname>
<given-names><![CDATA[J]]></given-names>
</name>
</person-group>
<article-title xml:lang="es"><![CDATA[Protocolo EMECAM: Análisis del efecto a corto plazo de la contaminación atmosférica sobre la mortalidad]]></article-title>
<source><![CDATA[Rev Esp Salud Púb]]></source>
<year>1999</year>
<page-range>177-185</page-range></nlm-citation>
</ref>
<ref id="B6">
<label>6</label><nlm-citation citation-type="book">
<person-group person-group-type="author">
<name>
<surname><![CDATA[Moreno Clavel]]></surname>
<given-names><![CDATA[J]]></given-names>
</name>
<name>
<surname><![CDATA[Moreno]]></surname>
<given-names><![CDATA[J]]></given-names>
</name>
<name>
<surname><![CDATA[Moreno Grau]]></surname>
<given-names><![CDATA[S]]></given-names>
</name>
<name>
<surname><![CDATA[Jiménez Torres]]></surname>
<given-names><![CDATA[E]]></given-names>
</name>
</person-group>
<article-title xml:lang="en"><![CDATA[Operative plan for pollution control in Cartagena. Spain]]></article-title>
<person-group person-group-type="editor">
<name>
<surname><![CDATA[Moreno Clavel]]></surname>
<given-names><![CDATA[J]]></given-names>
</name>
<name>
<surname><![CDATA[Moreno Grau]]></surname>
<given-names><![CDATA[J]]></given-names>
</name>
</person-group>
<source><![CDATA[Proceedings of the workshop on best available technologies for pollution control]]></source>
<year></year>
<publisher-loc><![CDATA[Luxemburgo ]]></publisher-loc>
<publisher-name><![CDATA[OPEUR]]></publisher-name>
</nlm-citation>
</ref>
<ref id="B7">
<label>7</label><nlm-citation citation-type="book">
<person-group person-group-type="author">
<name>
<surname><![CDATA[Ferrán Aranaz]]></surname>
<given-names><![CDATA[M]]></given-names>
</name>
</person-group>
<source><![CDATA[SPSS para Windows: Programación y Análisis]]></source>
<year>1996</year>
<publisher-loc><![CDATA[Madrid ]]></publisher-loc>
<publisher-name><![CDATA[McGraw-Hill]]></publisher-name>
</nlm-citation>
</ref>
<ref id="B8">
<label>8</label><nlm-citation citation-type="book">
<person-group person-group-type="author">
<name>
<surname><![CDATA[Abraira Santos]]></surname>
<given-names><![CDATA[V]]></given-names>
</name>
<name>
<surname><![CDATA[Pérez de Vargas Luque]]></surname>
<given-names><![CDATA[A]]></given-names>
</name>
</person-group>
<source><![CDATA[Métodos Multivariantes en Bioestadística]]></source>
<year>1996</year>
<publisher-loc><![CDATA[Madrid ]]></publisher-loc>
<publisher-name><![CDATA[Centro de Estudios Ramón Areces SA]]></publisher-name>
</nlm-citation>
</ref>
</ref-list>
</back>
</article>
