<?xml version="1.0" encoding="ISO-8859-1"?><article xmlns:mml="http://www.w3.org/1998/Math/MathML" xmlns:xlink="http://www.w3.org/1999/xlink" xmlns:xsi="http://www.w3.org/2001/XMLSchema-instance">
<front>
<journal-meta>
<journal-id>1135-5727</journal-id>
<journal-title><![CDATA[Revista Española de Salud Pública]]></journal-title>
<abbrev-journal-title><![CDATA[Rev. Esp. Salud Publica]]></abbrev-journal-title>
<issn>1135-5727</issn>
<publisher>
<publisher-name><![CDATA[Ministerio de Sanidad]]></publisher-name>
</publisher>
</journal-meta>
<article-meta>
<article-id>S1135-57271999000200019</article-id>
<title-group>
<article-title xml:lang="es"><![CDATA[Efectos a corto plazo de la contaminación atmosférica sobre la mortalidad: resultados del proyecto EMECAM en Vitoria-Gasteiz, 1990-94]]></article-title>
<article-title xml:lang="en"><![CDATA[Short-term effects of air pollution on the mortality. Results of the EMECAM project in the city of Vitoria-Gasteiz, 1990-1994]]></article-title>
</title-group>
<contrib-group>
<contrib contrib-type="author">
<name>
<surname><![CDATA[Pérez Boillos]]></surname>
<given-names><![CDATA[María José]]></given-names>
</name>
<xref ref-type="aff" rid="A01"/>
</contrib>
<contrib contrib-type="author">
<name>
<surname><![CDATA[Alonso López]]></surname>
<given-names><![CDATA[Andrés]]></given-names>
</name>
<xref ref-type="aff" rid="A02"/>
</contrib>
<contrib contrib-type="author">
<name>
<surname><![CDATA[Estibalez González]]></surname>
<given-names><![CDATA[Juan José]]></given-names>
</name>
<xref ref-type="aff" rid="A01"/>
</contrib>
<contrib contrib-type="author">
<name>
<surname><![CDATA[García Calabuig]]></surname>
<given-names><![CDATA[Miguel ángel]]></given-names>
</name>
<xref ref-type="aff" rid="A03"/>
</contrib>
</contrib-group>
<aff id="A01">
<institution><![CDATA[,Ayuntamiento de Vitoria-Gasteiz  ]]></institution>
<addr-line><![CDATA[ ]]></addr-line>
</aff>
<aff id="A02">
<institution><![CDATA[,Ayuntamiento de Vitoria-Gasteiz  ]]></institution>
<addr-line><![CDATA[ ]]></addr-line>
</aff>
<aff id="A03">
<institution><![CDATA[,Gobierno Vasco  ]]></institution>
<addr-line><![CDATA[ ]]></addr-line>
</aff>
<pub-date pub-type="pub">
<day>00</day>
<month>03</month>
<year>1999</year>
</pub-date>
<pub-date pub-type="epub">
<day>00</day>
<month>03</month>
<year>1999</year>
</pub-date>
<volume>73</volume>
<numero>2</numero>
<fpage>283</fpage>
<lpage>292</lpage>
<copyright-statement/>
<copyright-year/>
<self-uri xlink:href="http://scielo.isciii.es/scielo.php?script=sci_arttext&amp;pid=S1135-57271999000200019&amp;lng=en&amp;nrm=iso"></self-uri><self-uri xlink:href="http://scielo.isciii.es/scielo.php?script=sci_abstract&amp;pid=S1135-57271999000200019&amp;lng=en&amp;nrm=iso"></self-uri><self-uri xlink:href="http://scielo.isciii.es/scielo.php?script=sci_pdf&amp;pid=S1135-57271999000200019&amp;lng=en&amp;nrm=iso"></self-uri><abstract abstract-type="short" xml:lang="es"><p><![CDATA[FUNDAMENTO: El objetivo de este trabajo es evaluar la asociación a corto plazo entre los niveles de humos negros (HN) y SO2 y la mortalidad en Vitoria-Gasteiz para un período de cinco años, mediante la aplicación de la metodología de análisis estandarizada del proyecto EMECAM. MÉTODOS: Estudio ecológico de series temporales que trata de estimar la asociación entre las variaciones diarias de mortalidad (mortalidad total en todas las edades y mortalidad total en mayores de 70 años), y contaminación atmosférica (dióxido de azufre-SO2 y humos negros), utilizando modelos de regresión de Poisson. Se siguió la metodología EMECAM. RESULTADOS: La mediana de muertes diarias fue de tres en el total de la población y de dos en ancianos. El nivel medio de humos negros fue 51,15 m g/m³ y el de SO2 18,04 m g/m³. Se encontró una asociación estadísticamente significativa entre humos negros y mortalidad en ancianos durante el semestre frío, con un RR de 1,014 (IC 95%: 1,002-1,026), correspondiente a un incremento de 10 m g/m³ del contaminante. Parecía detectarse un umbral en 80-90m g/m³ de humos negros. La asociación con SO2 no fue significativa. CONCLUSIONES: Los niveles de humos negros del período estudiado se asocian a un incremento en la mortalidad en ancianos, coincidiendo con el resultado de otros estudios.]]></p></abstract>
<abstract abstract-type="short" xml:lang="en"><p><![CDATA[BACKGROUND: The objective of this article is that of assessing the short-term relationship between the black smoke (SM) and SO2 levels and the mortality in Vitoria-Gasteiz over a five-year period by means of employing the procedure for analysis standardized in the EMECAM Project. METHODS: Ecological time series study aimed at estimating the relationship between the daily fluctuations in the death rate (total mortality of all ages and total mortality for those over age 70) and air pollution (sulfur dioxide-SO2 and black smoke), employing the Poisson regression models. The EMECAM methodology was followed. RESULTS: The mediam of daily deaths was three for the entire population and two for the elderly. The mean black smoke level was 51.15 m g/m³ and that of SO2 18.04 m g/m³. A statistically significant relationship was found to exist between black smoke and the mortality for the elderly through the cold half of the year, with an RR of 1.014 (CI95%: 1.002-1.026), pertinent to a 10 m g/m³ rise in the pollutant. A threshold at 80-90 m g/m³ seemed to be detected for fog. The relationship with SO2 was not significant. CONCLUSIONS: The black smoke levels for the period studied are related to a rise in the mortality among the elderly, tallying with the results of other studies.]]></p></abstract>
<kwd-group>
<kwd lng="es"><![CDATA[Mortalidad]]></kwd>
<kwd lng="es"><![CDATA[Contaminación atmosférica]]></kwd>
<kwd lng="es"><![CDATA[Series temporales]]></kwd>
<kwd lng="es"><![CDATA[Proyecto EMECAM]]></kwd>
<kwd lng="es"><![CDATA[Regresión de Poisson]]></kwd>
<kwd lng="es"><![CDATA[Partículas]]></kwd>
<kwd lng="es"><![CDATA[Humos negros]]></kwd>
<kwd lng="es"><![CDATA[Dióxido de azufre]]></kwd>
<kwd lng="es"><![CDATA[Contaminantes ambientales]]></kwd>
<kwd lng="en"><![CDATA[Mortality]]></kwd>
<kwd lng="en"><![CDATA[Air pollution]]></kwd>
<kwd lng="en"><![CDATA[Time series]]></kwd>
<kwd lng="en"><![CDATA[EMECAM Project]]></kwd>
<kwd lng="en"><![CDATA[Poisson regression]]></kwd>
<kwd lng="en"><![CDATA[Particles]]></kwd>
<kwd lng="en"><![CDATA[Black smoke]]></kwd>
<kwd lng="en"><![CDATA[Sulfur dioxide]]></kwd>
<kwd lng="en"><![CDATA[Environmental pollutants]]></kwd>
</kwd-group>
</article-meta>
</front><body><![CDATA[  <b>      <p ALIGN="CENTER"><font size="4">EFECTOS A CORTO PLAZO DE LA CONTAMINACIÓN ATMOSFÉRICA SOBRE LA MORTALIDAD: RESULTADOS DEL PROYECTO EMECAM<i> </i>EN VITORIA-GASTEIZ, 1990-94</font></p> </b>      <p ALIGN="CENTER">&nbsp;</p>      <p ALIGN="JUSTIFY"><font size="3"><strong>María José Pérez Boillos (1), Andrés Alonso López (2) Juan José Estibalez González (1) y Miguel ángel García Calabuig (3)    <br> (1) Departamento Municipal de Salud y Consumo del Ayuntamiento de Vitoria-Gasteiz.    <br> (2) Servicio de Medio Ambiente del Ayuntamiento de Vitoria-Gasteiz.    <br> (3) Departamento de Sanidad del Gobierno Vasco.</strong></font></p>      <p ALIGN="JUSTIFY"><font size="3"><strong>Correspondencia    <br> Andrés Alonso López    <br> Servicio de Medio Ambiente    ]]></body>
<body><![CDATA[<br> Ayuntamiento de Vitoria-Gasteiz    <br> San Prudencio, 30    <br> 01005 Vitoria- Gasteiz    <br> (*) Este trabajo cuenta con una beca del Fondo de Investigaciones Sanitarias (Expediente núm 97/0051-10)</strong></font></p>  <hr>  <table border="0" width="100%">   <tr>     <td valign="top" width="48%">    <p ALIGN="CENTER"><font size="3"><b>RESUMEN</b></font></p>         <p ALIGN="JUSTIFY"><font size="3"><b>Fundamento</b>: El objetivo de este trabajo es     evaluar la asociación a corto plazo entre los niveles de humos negros (HN) y SO<sub>2</sub>     y la mortalidad en Vitoria-Gasteiz para un período de cinco años, mediante la     aplicación de la metodología de análisis estandarizada del proyecto EMECAM.</font></p>         <p ALIGN="JUSTIFY"><font size="3"><b>Métodos</b>: Estudio ecológico de series temporales     que trata de estimar la asociación entre las variaciones diarias de mortalidad     (mortalidad total en todas las edades y mortalidad total en mayores de 70 años), y     contaminación atmosférica (dióxido de azufre-SO<sub>2</sub> y humos negros), utilizando     modelos de regresión de Poisson. Se siguió la metodología EMECAM. </font></p>         <p ALIGN="JUSTIFY"><font size="3"><b>Resultados</b>: La mediana de muertes diarias fue de     tres en el total de la población y de dos en ancianos. El nivel medio de humos negros fue     51,15 m g/m<sup>3</sup> y el de SO<sub>2 </sub>18,04 m g/m<sup>3</sup>. Se encontró una     asociación estadísticamente significativa entre humos negros y mortalidad en ancianos     durante el semestre frío, con un RR de 1,014 (IC <sub>95%</sub>: 1,002-1,026),     correspondiente a un incremento de 10 m g/m<sup>3</sup> del contaminante. Parecía     detectarse un umbral en 80-90m g/m<sup>3</sup> de humos negros. La asociación con SO<sub>2</sub>     no fue significativa.</font></p>         <p ALIGN="JUSTIFY"><font size="3"><b>Conclusiones</b>: Los niveles de humos negros del     período estudiado se asocian a un incremento en la mortalidad en ancianos, coincidiendo     con el resultado de otros estudios.</font></p>         <p ALIGN="JUSTIFY"><font size="3"><b>Palabras clave:</b> Mortalidad. Contaminación     atmosférica. Series temporales. Proyecto EMECAM. Regresión de Poisson. Partículas.     Humos negros. Dióxido de azufre. Contaminantes ambientales.</font></td>     <td width="4%"></td>     <td valign="top" width="48%">    ]]></body>
<body><![CDATA[<p align="center"><font size="3"><b>ABSTRACT</b></font></p>         <p ALIGN="CENTER"><font size="3"><b>Short-term Effects of Air Pollution on the Mortality.     Results of the EMECAM Project in the city of Vitoria-Gasteiz, 1990-1994</b></font></p>         <p ALIGN="JUSTIFY"><font size="3"><b>Background: </b>The objective of this article is that     of assessing the short-term relationship between the black smoke (SM) and SO<sub>2</sub>     levels and the mortality in Vitoria-Gasteiz over a five-year period by means of employing     the procedure for analysis standardized in the EMECAM Project.</font></p>         <p ALIGN="JUSTIFY"><font size="3"><b>Methods:</b> Ecological time series study aimed at     estimating the relationship between the daily fluctuations in the death rate (total     mortality of all ages and total mortality for those over age 70) and air pollution (sulfur     dioxide-SO<sub>2</sub> and black smoke), employing the Poisson regression models. The     EMECAM methodology was followed.</font></p>         <p ALIGN="JUSTIFY"><font size="3"><b>Results: </b>The mediam of daily deaths was three for     the entire population and two for the elderly. The mean black smoke level was 51.15 m g/m<sup>3</sup>     and that of SO<sub>2</sub> 18.04 m g/m<sup>3</sup>. A statistically significant     relationship was found to exist between black smoke and the mortality for the elderly     through the cold half of the year, with an RR of 1.014 (CI<sub>95%</sub>: 1.002-1.026),     pertinent to a 10 m g/m<sup>3</sup> rise in the pollutant. A threshold at 80-90 m g/m<sup>3     </sup>seemed to be detected for fog. The relationship with SO<sub>2</sub> was not     significant.</font></p>         <p ALIGN="JUSTIFY"><font size="3"><b>Conclusions: </b>The black smoke levels for the     period studied are related to a rise in the mortality among the elderly, tallying with the     results of other studies.</font></p>         <p ALIGN="JUSTIFY"><font size="3"><b>Key words:</b> Mortality. Air pollution. Time series.     EMECAM Project. Poisson regression. Particles. Black smoke. Sulfur dioxide. Environmental     pollutants.</font></td>   </tr> </table>  <hr> <b>      <p ALIGN="CENTER"><font size="4">INTRODUCCIÓN</font></b></p>      <p ALIGN="JUSTIFY"><font size="3">En Vitoria-Gasteiz no existen trabajos previos que hayan cuantificado el efecto de la contaminación atmosférica sobre la salud. La ciudad cuenta con datos de monitorización de dióxido de azufre (SO<sub>2</sub>) y partículas en suspensión (humos negros) desde 1984 y no ha registrado episodios importantes de contaminación. Las principales fuentes de contaminación son el tráfico y la industria. Los niveles de humos negros detectados habitualmente son moderados y los de SO<sub>2</sub> bajos, inferiores a los registrados en la mayoría de las ciudades europeas participantes en otros estudios que han valorado la relación entre contaminación atmosférica y mortalidad<sup>1-10</sup>.</font></p>      <p ALIGN="JUSTIFY"><font size="3">El objetivo de este trabajo es evaluar la asociación a corto plazo entre los niveles de humos negros (HN) y SO<sub>2</sub> y la mortalidad en Vitoria-Gasteiz para un período de cinco años, mediante la aplicación de la metodología de análisis estandarizada del proyecto EMECAM <sup>11,12</sup>.</font></p>      ]]></body>
<body><![CDATA[<p><b>&nbsp;</p>      <p ALIGN="CENTER"><font size="4">MATERIAL Y METODO</font></b></p>      <p ALIGN="JUSTIFY"><font size="3">Se realizó un estudio ecológico de series temporales que utilizó el día como unidad de análisis, y con él se pretende estimar la asociación entre las variaciones diarias de mortalidad y contaminación atmosférica mediante la construcción de diferentes modelos de regresión de Poisson. Tanto en la elección de las variables como en la construcción del modelo, se siguió el procedimiento EMECAM, ya presentado con detalle en otros artículos de este número<sup>11,12</sup>.</font></p> <b>      <p ALIGN="JUSTIFY"><font size="3">Mortalidad</b><i>.</i> </font></p>      <p ALIGN="JUSTIFY"><font size="3">Como variables respuesta se utilizaron el número de defunciones diarias en todas las edades, por todas las causas excluyendo las externas (CIE-9 001-799) y el número de defunciones diarias por todas las causas, excluyendo las externas, en personas de 70 o más años. Los datos fueron facilitados por el EUSTAT (Instituto Vasco de Estadística) y el Departamento de Sanidad del Gobierno Vasco. Las series incluían las muertes de personas residentes en Vitoria-Gasteiz sucedidas desde el 1 de Enero de 1990 al 31 de Diciembre de 1994.</font></p> <b>      <p ALIGN="JUSTIFY"><font size="3">Contaminación</b>. </font></p>      <p ALIGN="JUSTIFY"><font size="3">La información sobre la contaminación atmosférica se obtuvo de la Red de Vigilancia gestionada por el Ayuntamiento de Vitoria-Gasteiz. La ciudad cuenta con una red manual que mide los valores medios de 24 horas de SO<sub>2</sub> y humos negros. La toma de muestras de los equipos está situada aproximadamente a tres metros del suelo. Los datos son recogidos desde las 0 horas de un día hasta las 0 horas del día siguiente. La medición de las partículas en suspensión se realiza por el método del humo normalizado, con retención de las partículas en un filtro tipo Whatman nº1 y cuantificación mediante un método reflectométrico (reflectómetro EEL). Este método determina la intensidad de la negrura producida principalmente por partículas con un diámetro menor de 4 µ m <sup>13,14</sup>. La medición del SO<sub>2</sub> se realizó, en 1990 por el método colorimétrico de la Thorina y en el resto del período de estudio por la captación del contaminante con H<sub>2</sub>O<sub>2</sub> al 0,3% y la determinación de la concentración de anión sulfato por cromatografía iónica con supresión química para SO<sub>2</sub>. Antes de aceptar el cambio de técnica se realizó un estudio de fiabilidad entre ambos métodos, comprobándose que el índice de correlación era del 0,99 y que la diferencia de medias se situaba en torno a 1m g/m<sup>3</sup>. Durante el período de estudio existían en la ciudad cuatro captadores manuales, situados en el área urbana, en áreas de tráfico medio e intenso. En el estudio sólo se incluyeron tres de ellos, ya que el cuarto, mostraba un porcentaje de valores válidos inferior al 75%; en los otros tres, este porcentaje estaba entre el 88,3-92,4%. La correlación entre la estación descartada y el resto era 0,7. Entre las estaciones elegidas el índice de correlación era del 0,57-0,59 para HN y 0,49 a 0,59 para SO<sub>2</sub>. </font></p> <b>      <p ALIGN="JUSTIFY"><font size="3">Variables meteorológicas</b>. </font></p>      <p ALIGN="JUSTIFY"><font size="3">Las variables utilizadas fueron la temperatura media (media de la temperatura mínima y máxima de cada día) y la humedad relativa diaria (media de la humedad a las 0, 7, 13 y 18 horas). Ambas variables se obtuvieron de la información recogida por el Instituto Nacional de Meteorología en la estación del Aeropuerto de Foronda, a 5 Km de la ciudad. Aunque existían otras estaciones dentro de la ciudad, se decidió elegir ésta porque los datos estaban disponibles de forma regular para todo el período de estudio.</font></p> <b>      <p ALIGN="JUSTIFY"><font size="3">Gripe</b>. </font></p>      ]]></body>
<body><![CDATA[<p ALIGN="JUSTIFY"><font size="3">Los datos de gripe se obtuvieron a partir de las declaraciones semanales (EDOS) comunicadas al Servicio de Epidemiología de la Delegación Territorial de Sanidad de Alava. La cobertura media de declaración fue del 83,1%, no variando de modo significativo a lo largo del período de estudio.</font></p>      <p><b>&nbsp;</p>      <p ALIGN="CENTER"><font size="4">RESULTADOS </font></b></p>      <p ALIGN="JUSTIFY"><font size="3">La mediana de muertes diarias a lo largo de todo el período fue de 3 para todas las edades (media de 3,5) y de 2 para el grupo de 70 o más años (media de 2,4). La serie presentó una distribución estacional aumentando el número de fallecimientos en el semestre frío respecto al cálido (p&lt;0,01) (<a href="#tab1">tabla 1</a>). No se registraron variaciones significativas en la mortalidad entre los años que componían el período de estudio, ni entre los días de la semana. </font></p>      <p><a name="tab1"></a>&nbsp;&nbsp;&nbsp; <b></p>      <p ALIGN="CENTER"><font size="3">Tabla 1    <br> Contaminación, características meteorológicas, gripe, y mortalidad en Vitoria-Gasteiz (1990-94)</font></p> </b>    <div align="center">    <center>  <table BORDER="0" CELLSPACING="1" bgcolor="#ECECEC">   <tr>     <td VALIGN="top" bgcolor="#C0C0C0">&nbsp; </td>     <td VALIGN="top" bgcolor="#C0C0C0">    <p ALIGN="JUSTIFY"><font size="3">Período</font></td>     <td VALIGN="top" bgcolor="#C0C0C0">    ]]></body>
<body><![CDATA[<p ALIGN="CENTER"><font size="3">media</font></td>     <td VALIGN="top" bgcolor="#C0C0C0">    <p ALIGN="CENTER"><font size="3">p50</font></td>     <td VALIGN="top" bgcolor="#C0C0C0">    <p ALIGN="CENTER"><font size="3">p10</font></td>     <td VALIGN="top" bgcolor="#C0C0C0">    <p ALIGN="CENTER"><font size="3">p90</font></td>     <td VALIGN="top" bgcolor="#C0C0C0">    <p ALIGN="CENTER"><font size="3">% perdidos</font></td>   </tr>   <tr>     <td VALIGN="top"><b>    <p ALIGN="JUSTIFY"><font size="3">Humos negros</font></b></td>     <td VALIGN="top">    <p ALIGN="JUSTIFY"><font size="3">todo el año</font></td>     <td VALIGN="top">    <p ALIGN="CENTER"><font size="3">51,15</font></td>     <td VALIGN="top">    <p ALIGN="CENTER"><font size="3">45,00</font></td>     <td VALIGN="top">    <p ALIGN="CENTER"><font size="3">19,33</font></td>     <td VALIGN="top">    ]]></body>
<body><![CDATA[<p ALIGN="CENTER"><font size="3">88,33</font></td>     <td VALIGN="top">    <p ALIGN="CENTER"><font size="3">1,6</font></td>   </tr>   <tr>     <td VALIGN="top">    <p ALIGN="left"><font size="3">(m g/m<sup>3</sup>)</font></td>     <td VALIGN="top">    <p ALIGN="JUSTIFY"><font size="3">semestre frío</font></td>     <td VALIGN="top">    <p ALIGN="CENTER"><font size="3">57,95</font></td>     <td VALIGN="top">    <p ALIGN="CENTER"><font size="3">49,67</font></td>     <td VALIGN="top">    <p ALIGN="CENTER"><font size="3">21,33</font></td>     <td VALIGN="top">    <p ALIGN="CENTER"><font size="3">102,67</font></td>     <td VALIGN="top">    <p ALIGN="CENTER"><font size="3">2,9</font></td>   </tr>   <tr>     <td VALIGN="top">&nbsp;&nbsp; </td>     <td VALIGN="top">    <p ALIGN="JUSTIFY"><font size="3">semestre cálido</font></td>     <td VALIGN="top">    ]]></body>
<body><![CDATA[<p ALIGN="CENTER"><font size="3">44,63</font></td>     <td VALIGN="top">    <p ALIGN="CENTER"><font size="3">41,00</font></td>     <td VALIGN="top">    <p ALIGN="CENTER"><font size="3">18,00</font></td>     <td VALIGN="top">    <p ALIGN="CENTER"><font size="3">76,50</font></td>     <td VALIGN="top">    <p ALIGN="CENTER"><font size="3">0,3</font></td>   </tr>   <tr>     <td VALIGN="top"><b>    <p ALIGN="JUSTIFY"><font size="3">SO<sub>2</sub> </font></b></td>     <td VALIGN="top">    <p ALIGN="JUSTIFY"><font size="3">todo el año</font></td>     <td VALIGN="top">    <p ALIGN="CENTER"><font size="3">18,04</font></td>     <td VALIGN="top">    <p ALIGN="CENTER"><font size="3">16,00</font></td>     <td VALIGN="top">    <p ALIGN="CENTER"><font size="3">7,33</font></td>     <td VALIGN="top">    ]]></body>
<body><![CDATA[<p ALIGN="CENTER"><font size="3">31,33</font></td>     <td VALIGN="top">    <p ALIGN="CENTER"><font size="3">1,8</font></td>   </tr>   <tr>     <td VALIGN="top">    <p ALIGN="left"><font size="3">(m g/m<sup>3</sup>)</font></td>     <td VALIGN="top">    <p ALIGN="JUSTIFY"><font size="3">semestre frío</font></td>     <td VALIGN="top">    <p ALIGN="CENTER"><font size="3">22,31</font></td>     <td VALIGN="top">    <p ALIGN="CENTER"><font size="3">20,33</font></td>     <td VALIGN="top">    <p ALIGN="CENTER"><font size="3">8,33</font></td>     <td VALIGN="top">    <p ALIGN="CENTER"><font size="3">38,00</font></td>     <td VALIGN="top">    <p ALIGN="CENTER"><font size="3">2,9</font></td>   </tr>   <tr>     <td VALIGN="top">&nbsp;&nbsp; </td>     <td VALIGN="top">    <p ALIGN="JUSTIFY"><font size="3">semestre cálido</font></td>     <td VALIGN="top">    ]]></body>
<body><![CDATA[<p ALIGN="CENTER"><font size="3">13,92</font></td>     <td VALIGN="top">    <p ALIGN="CENTER"><font size="3">13,67</font></td>     <td VALIGN="top">    <p ALIGN="CENTER"><font size="3">7,00</font></td>     <td VALIGN="top">    <p ALIGN="CENTER"><font size="3">21,33</font></td>     <td VALIGN="top">    <p ALIGN="CENTER"><font size="3">0,7</font></td>   </tr>   <tr>     <td VALIGN="top"><b>    <p ALIGN="JUSTIFY"><font size="3">Temperatura </font></b></td>     <td VALIGN="top">    <p ALIGN="JUSTIFY"><font size="3">todo el año</font></td>     <td VALIGN="top">    <p ALIGN="CENTER"><font size="3">11,59</font></td>     <td VALIGN="top">    <p ALIGN="CENTER"><font size="3">11,10</font></td>     <td VALIGN="top">    <p ALIGN="CENTER"><font size="3">3,80</font></td>     <td VALIGN="top">    ]]></body>
<body><![CDATA[<p ALIGN="CENTER"><font size="3">20,30</font></td>     <td VALIGN="top">    <p ALIGN="CENTER"><font size="3">0</font></td>   </tr>   <tr>     <td VALIGN="top">    <p ALIGN="left"><font size="3">(ºC)</font></td>     <td VALIGN="top">    <p ALIGN="JUSTIFY"><font size="3">semestre frío</font></td>     <td VALIGN="top">    <p ALIGN="CENTER"><font size="3">6,93</font></td>     <td VALIGN="top">    <p ALIGN="CENTER"><font size="3">6,80</font></td>     <td VALIGN="top">    <p ALIGN="CENTER"><font size="3">2,40</font></td>     <td VALIGN="top">    <p ALIGN="CENTER"><font size="3">11,73</font></td>     <td VALIGN="top">    <p ALIGN="CENTER"><font size="3">0</font></td>   </tr>   <tr>     <td VALIGN="top">&nbsp; </td>     <td VALIGN="top">    <p ALIGN="JUSTIFY"><font size="3">semestre cálido</font></td>     <td VALIGN="top">    ]]></body>
<body><![CDATA[<p ALIGN="CENTER"><font size="3">16,18</font></td>     <td VALIGN="top">    <p ALIGN="CENTER"><font size="3">16,00</font></td>     <td VALIGN="top">    <p ALIGN="CENTER"><font size="3">10,30</font></td>     <td VALIGN="top">    <p ALIGN="CENTER"><font size="3">22,00</font></td>     <td VALIGN="top">    <p ALIGN="CENTER"><font size="3">0</font></td>   </tr>   <tr>     <td VALIGN="top"><b>    <p ALIGN="JUSTIFY"><font size="3">Humedad relativa</font></b></td>     <td VALIGN="top">    <p ALIGN="JUSTIFY"><font size="3">todo el año</font></td>     <td VALIGN="top">    <p ALIGN="CENTER"><font size="3">76,47</font></td>     <td VALIGN="top">    <p ALIGN="CENTER"><font size="3">77,00</font></td>     <td VALIGN="top">    <p ALIGN="CENTER"><font size="3">61,00</font></td>     <td VALIGN="top">    ]]></body>
<body><![CDATA[<p ALIGN="CENTER"><font size="3">90,00</font></td>     <td VALIGN="top">    <p ALIGN="CENTER"><font size="3">0</font></td>   </tr>   <tr>     <td VALIGN="top">    <p ALIGN="left"><font size="3">(%)</font></td>     <td VALIGN="top">    <p ALIGN="JUSTIFY"><font size="3">semestre frío</font></td>     <td VALIGN="top">    <p ALIGN="CENTER"><font size="3">80,20</font></td>     <td VALIGN="top">    <p ALIGN="CENTER"><font size="3">82,00</font></td>     <td VALIGN="top">    <p ALIGN="CENTER"><font size="3">67,00</font></td>     <td VALIGN="top">    <p ALIGN="CENTER"><font size="3">92,00</font></td>     <td VALIGN="top">    <p ALIGN="CENTER"><font size="3">0</font></td>   </tr>   <tr>     <td VALIGN="top">&nbsp; </td>     <td VALIGN="top">    <p ALIGN="JUSTIFY"><font size="3">semestre cálido</font></td>     <td VALIGN="top">    ]]></body>
<body><![CDATA[<p ALIGN="CENTER"><font size="3">72,80</font></td>     <td VALIGN="top">    <p ALIGN="CENTER"><font size="3">73,00</font></td>     <td VALIGN="top">    <p ALIGN="CENTER"><font size="3">58,00</font></td>     <td VALIGN="top">    <p ALIGN="CENTER"><font size="3">87,00</font></td>     <td VALIGN="top">    <p ALIGN="CENTER"><font size="3">0</font></td>   </tr>   <tr>     <td VALIGN="top"><b>    <p ALIGN="JUSTIFY"><font size="3">Gripe</font></b></td>     <td VALIGN="top">    <p ALIGN="JUSTIFY"><font size="3">todo el año</font></td>     <td VALIGN="top">    <p ALIGN="CENTER"><font size="3">66,49</font></td>     <td VALIGN="top">    <p ALIGN="CENTER"><font size="3">36</font></td>     <td VALIGN="top">    <p ALIGN="CENTER"><font size="3">10</font></td>     <td VALIGN="top">    ]]></body>
<body><![CDATA[<p ALIGN="CENTER"><font size="3">130,90</font></td>     <td VALIGN="top">    <p ALIGN="CENTER"><font size="3">0</font></td>   </tr>   <tr>     <td VALIGN="top">    <p ALIGN="left"><font size="3">(nº casos/día)</font></td>     <td VALIGN="top">    <p ALIGN="JUSTIFY"><font size="3">otoño</font></td>     <td VALIGN="top">    <p ALIGN="CENTER"><font size="3">54,86</font></td>     <td VALIGN="top">    <p ALIGN="CENTER"><font size="3">55</font></td>     <td VALIGN="top">    <p ALIGN="CENTER"><font size="3">27</font></td>     <td VALIGN="top">    <p ALIGN="CENTER"><font size="3">83</font></td>     <td VALIGN="top">    <p ALIGN="CENTER"><font size="3">0</font></td>   </tr>   <tr>     <td VALIGN="top">&nbsp; </td>     <td VALIGN="top">    <p ALIGN="JUSTIFY"><font size="3">invierno</font></td>     <td VALIGN="top">    ]]></body>
<body><![CDATA[<p ALIGN="CENTER"><font size="3">158,94</font></td>     <td VALIGN="top">    <p ALIGN="CENTER"><font size="3">112,0</font></td>     <td VALIGN="top">    <p ALIGN="CENTER"><font size="3">43,4</font></td>     <td VALIGN="top">    <p ALIGN="CENTER"><font size="3">315,00</font></td>     <td VALIGN="top">    <p ALIGN="CENTER"><font size="3">0</font></td>   </tr>   <tr>     <td VALIGN="top">&nbsp; </td>     <td VALIGN="top">    <p ALIGN="JUSTIFY"><font size="3">primavera</font></td>     <td VALIGN="top">    <p ALIGN="CENTER"><font size="3">39,94</font></td>     <td VALIGN="top">    <p ALIGN="CENTER"><font size="3">30</font></td>     <td VALIGN="top">    <p ALIGN="CENTER"><font size="3">16</font></td>     <td VALIGN="top">    <p ALIGN="CENTER"><font size="3">79</font></td>     <td VALIGN="top">    ]]></body>
<body><![CDATA[<p ALIGN="CENTER"><font size="3">0</font></td>   </tr>   <tr>     <td VALIGN="top">&nbsp;&nbsp; </td>     <td VALIGN="top">    <p ALIGN="JUSTIFY"><font size="3">verano</font></td>     <td VALIGN="top">    <p ALIGN="CENTER"><font size="3">13,88</font></td>     <td VALIGN="top">    <p ALIGN="CENTER"><font size="3">12</font></td>     <td VALIGN="top">    <p ALIGN="CENTER"><font size="3">6</font></td>     <td VALIGN="top">    <p ALIGN="CENTER"><font size="3">26</font></td>     <td VALIGN="top">    <p ALIGN="CENTER"><font size="3">0</font></td>   </tr>   <tr>     <td VALIGN="top"><b>    <p ALIGN="JUSTIFY"><font size="3">Muertes diarias </font></b></td>     <td VALIGN="top">    <p ALIGN="JUSTIFY"><font size="3">todo el año</font></td>     <td VALIGN="top">    <p ALIGN="CENTER"><font size="3">3,53</font></td>     <td VALIGN="top">    ]]></body>
<body><![CDATA[<p ALIGN="CENTER"><font size="3">3,00</font></td>     <td VALIGN="top">    <p ALIGN="CENTER"><font size="3">1,00</font></td>     <td VALIGN="top">    <p ALIGN="CENTER"><font size="3">6,00</font></td>     <td VALIGN="top">    <p ALIGN="CENTER"><font size="3">0</font></td>   </tr>   <tr>     <td VALIGN="top"><b>    <p ALIGN="JUSTIFY"><font size="3">en todos los</font></b></td>     <td VALIGN="top">    <p ALIGN="JUSTIFY"><font size="3">semestre frío</font></td>     <td VALIGN="top">    <p ALIGN="CENTER"><font size="3">3,82</font></td>     <td VALIGN="top">    <p ALIGN="CENTER"><font size="3">4,00</font></td>     <td VALIGN="top">    <p ALIGN="CENTER"><font size="3">1,00</font></td>     <td VALIGN="top">    <p ALIGN="CENTER"><font size="3">6,00</font></td>     <td VALIGN="top">    ]]></body>
<body><![CDATA[<p ALIGN="CENTER"><font size="3">0</font></td>   </tr>   <tr>     <td VALIGN="top"><b>    <p ALIGN="JUSTIFY"><font size="3">grupos de edad</font></b></td>     <td VALIGN="top">    <p ALIGN="JUSTIFY"><font size="3">semestre cálido</font></td>     <td VALIGN="top">    <p ALIGN="CENTER"><font size="3">3,25</font></td>     <td VALIGN="top">    <p ALIGN="CENTER"><font size="3">3,00</font></td>     <td VALIGN="top">    <p ALIGN="CENTER"><font size="3">1,00</font></td>     <td VALIGN="top">    <p ALIGN="CENTER"><font size="3">6,00</font></td>     <td VALIGN="top">    <p ALIGN="CENTER"><font size="3">0</font></td>   </tr>   <tr>     <td VALIGN="top"><b>    <p ALIGN="JUSTIFY"><font size="3">Muertes diarias</font></b></td>     <td VALIGN="top">    <p ALIGN="JUSTIFY"><font size="3">todo el año</font></td>     <td VALIGN="top">    ]]></body>
<body><![CDATA[<p ALIGN="CENTER"><font size="3">2,38</font></td>     <td VALIGN="top">    <p ALIGN="CENTER"><font size="3">2,00</font></td>     <td VALIGN="top">    <p ALIGN="CENTER"><font size="3">1,00</font></td>     <td VALIGN="top">    <p ALIGN="CENTER"><font size="3">4,00</font></td>     <td VALIGN="top">    <p ALIGN="CENTER"><font size="3">0</font></td>   </tr>   <tr>     <td VALIGN="top"><b>    <p ALIGN="JUSTIFY"><font size="3">en mayores de 70 </font></b></td>     <td VALIGN="top">    <p ALIGN="JUSTIFY"><font size="3">semestre frío</font></td>     <td VALIGN="top">    <p ALIGN="CENTER"><font size="3">2,59</font></td>     <td VALIGN="top">    <p ALIGN="CENTER"><font size="3">2,00</font></td>     <td VALIGN="top">    <p ALIGN="CENTER"><font size="3">1,00</font></td>     <td VALIGN="top">    ]]></body>
<body><![CDATA[<p ALIGN="CENTER"><font size="3">5,00</font></td>     <td VALIGN="top">    <p ALIGN="CENTER"><font size="3">0</font></td>   </tr>   <tr>     <td VALIGN="top"><b>    <p ALIGN="JUSTIFY"><font size="3">años</font></b></td>     <td VALIGN="top">    <p ALIGN="JUSTIFY"><font size="3">semestre cálido</font></td>     <td VALIGN="top">    <p ALIGN="CENTER"><font size="3">2,17</font></td>     <td VALIGN="top">    <p ALIGN="CENTER"><font size="3">2,00</font></td>     <td VALIGN="top">    <p ALIGN="CENTER"><font size="3">0,00</font></td>     <td VALIGN="top">    <p ALIGN="CENTER"><font size="3">4,00</font></td>     <td VALIGN="top">    <p ALIGN="CENTER"><font size="3">0</font></td>   </tr> </table> </center></div>      <p ALIGN="JUSTIFY">&nbsp;</p>      ]]></body>
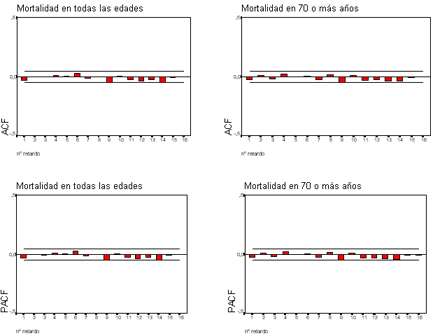
<body><![CDATA[<p ALIGN="JUSTIFY"><font size="3">En cuanto a los contaminantes atmosféricos estudiados, los valores medios para todo el período fueron 51,15 m g/m<sup>3</sup> para humos negros y 18,04 m g/m<sup>3</sup> para SO<sub>2</sub>. En 52 de los días, los niveles medios diarios de HN superaron los 125 m g/m<sup>3</sup>; los de SO<sub>2</sub> se mantuvieron siempre casi dos veces por debajo de ese valor (<a href="#tab1">tabla 1</a>). En los años estudiados se produjo una disminución en los valores de HN, que pasaron de 61,7 a 43,82 m g/m<sup>3</sup> (p&lt;0,01) y un ligero aumento en los de SO<sub>2</sub> (de 15,4 a 21,2 m g/m<sup>3</sup>, p&lt;0,01). Como era de esperar, los niveles medios de ambos contaminantes eran mayores en el semestre frío y disminuían durante los fines de semana. El índice de correlación entre los dos contaminantes fue 0,42.</font></p>      <p ALIGN="JUSTIFY"><font size="3">La temperatura media estuvo cercana a los 12º C, con una diferencia aproximada de 10ºC entre el semestre cálido y el frío. En cuanto a la humedad relativa, la media se situó en 76,5%, siendo mayor en el semestre frío (<a href="#tab1">tabla 1</a>).</font></p>      <p ALIGN="JUSTIFY"><font size="3">Tras la construcción de los modelos de regresión de Poisson para cada indicador de mortalidad, comprobamos que los residuos no presentaban autocorrelaciones significativas (<a href="#fig1">figura 1-4</a>).</font></p>      <p ALIGN="JUSTIFY"><a name="fig1"></a>&nbsp;&nbsp;&nbsp; </p> <font size="3"><b>      <p ALIGN="center">Figuras 1-4    <br> Funciones de autocorrelación de los residuos de los modelos basales utilizados para cada indicador de mortalidad</p> </b></font>      <p ALIGN="center"><!-- big --><!-- big --><img src="/img/fbpe/resp/v73n2/vit2.gif" alt="vit2.gif (14516 bytes)"><!-- /big --><!-- /big --></p>      
<p ALIGN="center">&nbsp;</p>      <p ALIGN="JUSTIFY"><font size="3">La <a href="#tab2">tabla 2</a> y las <a href="#fig5">figuras 5</a> y <a href="#fig5">6</a> muestran los riesgos relativos, correspondientes a incrementos de 10 m g/m<sup>3</sup> y a aumentos equivalentes al rango p90/p10 de cada contaminante, estimados para el global de la población y para el subgrupo con 70 o más años. Solamente resultó significativa la asociación entre humos negros y mortalidad en personas de 70 o más años durante el semestre frío del año. Un incremento de 10 m g/m<sup>3</sup> de HN producía un aumento de 1,4% en el riesgo de morir. Cuando se valoró la relación entre este contaminante y la mortalidad en este grupo de edad durante todo el año, la asociación resultó débilmente significativa (p=0,053). En este caso el riesgo era ligeramente menor, ya que un aumento de 10 m g/m<sup>3</sup> en el nivel de HN suponía una subida de 1,04% en el riesgo de morir. El resto de las asociaciones testadas mortalidad-contaminante no alcanzaron significación estadística, aunque fueron positivas en todas las épocas del año (exceptuando el caso de los HN durante el semestre cálido).</font></p> <b>      <p><a name="fig5"></a>&nbsp; </p> <font size="3">      ]]></body>
<body><![CDATA[<p ALIGN="center">Figuras 5 y 6    <br> Riesgos relativos de morir e intervalo de confianza al 95% (IC 95%) asociados a incrementos equivalentes al rango p90/p10 de humos negros y dióxido de azufre (SO<sub>2</sub>). Resultados para todo el año y por semestres. Vitoria-Gasteiz, 1990-94.</p> </font>      <p align="center"><!-- big --><!-- big --><img src="/img/fbpe/resp/v73n2/vit4.gif" alt="vit4.gif (10631 bytes)"><!-- /big --><!-- /big --></p>      
<p align="center"><a name="tab2"></a>&nbsp;&nbsp; </p>      <p ALIGN="CENTER"><font size="3">TABLA 2    <br> Riesgos relativos de morir e intervalo de confianza al 95% (IC 95%) asociados a incrementos de 10 m g/m<sup>3</sup> de humos negros y dióxido de azufre (SO<sub>2</sub>). Resultados para todo el año y por semestres. Vitoria-Gasteiz, 1990-94.</font></p> </b>    <div align="center">    <center>  <table BORDER="0" CELLSPACING="1" bgcolor="#ECECEC">   <tr>     <td VALIGN="top" bgcolor="#C0C0C0">&nbsp; </td>     <td VALIGN="top" COLSPAN="3" bgcolor="#C0C0C0"><b>    <p ALIGN="CENTER"><font size="3">Mortalidad     en todas las edades</font></b></td>     <td VALIGN="top" COLSPAN="3" bgcolor="#C0C0C0"><b>    <p ALIGN="CENTER"><font size="3">Mortalidad     en mayores 70 años</font></b></td>   </tr>   <tr>     <td VALIGN="top" bgcolor="#C0C0C0">&nbsp; </td>     <td VALIGN="top" bgcolor="#C0C0C0">    ]]></body>
<body><![CDATA[<p ALIGN="CENTER"><font size="3">Ret</font></td>     <td VALIGN="top" bgcolor="#C0C0C0">    <p ALIGN="CENTER"><font size="3">RR</font></td>     <td VALIGN="top" bgcolor="#C0C0C0">    <p ALIGN="CENTER"><font size="3">IC 95%</font></td>     <td VALIGN="top" bgcolor="#C0C0C0">    <p ALIGN="CENTER"><font size="3">Ret</font></td>     <td VALIGN="top" bgcolor="#C0C0C0">    <p ALIGN="CENTER"><font size="3">RR</font></td>     <td VALIGN="top" bgcolor="#C0C0C0">    <p ALIGN="CENTER"><font size="3">IC 95%</font></td>   </tr>   <tr>     <td VALIGN="top"><b>    <p ALIGN="JUSTIFY"><font size="3">Humos negros</font></b></td>     <td VALIGN="top">&nbsp; </td>     <td VALIGN="top">&nbsp; </td>     <td VALIGN="top">&nbsp; </td>     <td VALIGN="top">&nbsp; </td>     <td VALIGN="top">&nbsp; </td>     <td VALIGN="top">&nbsp; </td>   </tr>   <tr>     <td VALIGN="top">    <p ALIGN="JUSTIFY"><font size="3">Todo el año</font></td>     <td VALIGN="top">    <p ALIGN="CENTER"><font size="3">1</font></td>     <td VALIGN="top">    <p ALIGN="CENTER"><font size="3">1,0063</font></td>     <td VALIGN="top">    ]]></body>
<body><![CDATA[<p ALIGN="CENTER"><font size="3">0,9968-1,0160</font></td>     <td VALIGN="top">    <p ALIGN="CENTER"><font size="3">1</font></td>     <td VALIGN="top">    <p ALIGN="CENTER"><font size="3">1,0104</font></td>     <td VALIGN="top">    <p ALIGN="CENTER"><font size="3">0,9998-1,0210</font></td>   </tr>   <tr>     <td VALIGN="top">    <p ALIGN="JUSTIFY"><font size="3">Semestre frío</font></td>     <td VALIGN="top">    <p ALIGN="CENTER"><font size="3">2</font></td>     <td VALIGN="top">    <p ALIGN="CENTER"><font size="3">1,0085</font></td>     <td VALIGN="top">    <p ALIGN="CENTER"><font size="3">0,9979-1,0193</font></td>     <td VALIGN="top">    <p ALIGN="CENTER"><font size="3">1</font></td>     <td VALIGN="top">    <p ALIGN="CENTER"><font size="3">1,0138</font></td>     <td VALIGN="top">    ]]></body>
<body><![CDATA[<p ALIGN="CENTER"><font size="3">1,0017-1,0260</font></td>   </tr>   <tr>     <td VALIGN="top">    <p ALIGN="JUSTIFY"><font size="3">Semestre cálido</font></td>     <td VALIGN="top">    <p ALIGN="CENTER"><font size="3">4</font></td>     <td VALIGN="top">    <p ALIGN="CENTER"><font size="3">0,9858</font></td>     <td VALIGN="top">    <p ALIGN="CENTER"><font size="3">0,9678-1,0041</font></td>     <td VALIGN="top">    <p ALIGN="CENTER"><font size="3">4</font></td>     <td VALIGN="top">    <p ALIGN="CENTER"><font size="3">0,9868</font></td>     <td VALIGN="top">    <p ALIGN="CENTER"><font size="3">0,9665-1,0075</font></td>   </tr>   <tr>     <td VALIGN="top"><b>    <p ALIGN="JUSTIFY"><font size="3">SO<sub>2</sub></font></b></td>     <td VALIGN="top">&nbsp; </td>     <td VALIGN="top">&nbsp; </td>     <td VALIGN="top">&nbsp;&nbsp; </td>     <td VALIGN="top">&nbsp;&nbsp; </td>     <td VALIGN="top">&nbsp;&nbsp; </td>     <td VALIGN="top">&nbsp; </td>   </tr>   <tr>     <td VALIGN="top">    <p ALIGN="JUSTIFY"><font size="3">Todo el año</font></td>     <td VALIGN="top">    ]]></body>
<body><![CDATA[<p ALIGN="CENTER"><font size="3">5</font></td>     <td VALIGN="top">    <p ALIGN="CENTER"><font size="3">1,0204</font></td>     <td VALIGN="top">    <p ALIGN="CENTER"><font size="3">0,9920-1,0496</font></td>     <td VALIGN="top">    <p ALIGN="CENTER"><font size="3">5</font></td>     <td VALIGN="top">    <p ALIGN="CENTER"><font size="3">1,0237</font></td>     <td VALIGN="top">    <p ALIGN="CENTER"><font size="3">0,9897-1,0588</font></td>   </tr>   <tr>     <td VALIGN="top">    <p ALIGN="JUSTIFY"><font size="3">Semestre frío</font></td>     <td VALIGN="top">    <p ALIGN="CENTER"><font size="3">5</font></td>     <td VALIGN="top">    <p ALIGN="CENTER"><font size="3">1,0199</font></td>     <td VALIGN="top">    <p ALIGN="CENTER"><font size="3">0,9890-1,0517</font></td>     <td VALIGN="top">    ]]></body>
<body><![CDATA[<p ALIGN="CENTER"><font size="3">5</font></td>     <td VALIGN="top">    <p ALIGN="CENTER"><font size="3">1,0245</font></td>     <td VALIGN="top">    <p ALIGN="CENTER"><font size="3">0,9873-1,0632</font></td>   </tr>   <tr>     <td VALIGN="top">    <p ALIGN="JUSTIFY"><font size="3">Semestre cálido</font></td>     <td VALIGN="top">    <p ALIGN="CENTER"><font size="3">2</font></td>     <td VALIGN="top">    <p ALIGN="CENTER"><font size="3">1,0349</font></td>     <td VALIGN="top">    <p ALIGN="CENTER"><font size="3">0,9678-1,1066</font></td>     <td VALIGN="top">    <p ALIGN="CENTER"><font size="3">0</font></td>     <td VALIGN="top">    <p ALIGN="CENTER"><font size="3">1,0593</font></td>     <td VALIGN="top">    <p ALIGN="CENTER"><font size="3">0,9781-1,1472</font></td>   </tr>   <tr>     <td VALIGN="top" colspan="7">    ]]></body>
<body><![CDATA[<p ALIGN="JUSTIFY"><font size="3">(Ret: retardo; RR: riesgo     relativo)</font></td>   </tr> </table> </center></div>      <p ALIGN="JUSTIFY">&nbsp;</p>      <p ALIGN="JUSTIFY"><font size="3">Las <a href="#fig7">figuras 7</a> y <a href="#fig7">8</a> muestran la relación exposición-respuesta entre los residuos ajustados de mortalidad y los retardos de HN que resultaron más significativos en el análisis. En el caso de la mortalidad en personas de 70 o más años, la curva presentaba forma de meseta para los niveles más bajos del contaminante, y se hacía lineal a partir de 80-90 m g/m<sup>3</sup> (cuando estudiábamos la mortalidad durante todo el año y el semestre frío) o a partir de 110-120 m g/m<sup>3 </sup>(cuando lo hacíamos para el semestre más cálido). Durante el semestre frío, la curva volvía a tener forma de meseta a partir de 120-130m g/m<sup>3</sup>. Los diagramas de dispersión de SO<sub>2</sub> no mostraban una clara relación dosis-respuesta.</font></p>      <p ALIGN="JUSTIFY"><a name="fig7"></a>&nbsp;&nbsp; </p> <font size="3"><b>      <p ALIGN="center">Figuras 7 y 8    <br> Gráficos de dispersión y ajuste no paramétrico de regresiones localmente ponderadas (lowess) de la relación entre los residuos ajustados de mortalidad y el primer retardo de humos negros. Vitoria-Gasteiz, 1990-94. </p> </b></font>      <p align="center"><b><!-- big --><!-- big --><img src="/img/fbpe/resp/v73n2/vit3.gif" alt="vit3.gif (26995 bytes)"><!-- /big --><!-- /big --></p>      
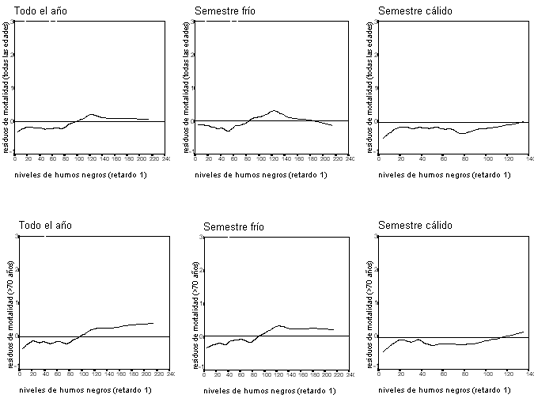
<p align="center">&nbsp;</p>      <p ALIGN="CENTER"><font size="4">CONCLUSIONES</font></b></p>      <p ALIGN="JUSTIFY"><font size="3">A modo de conclusión, podemos decir que: 1) El estudio sugiere que existe una asociación positiva entre los niveles de contaminación atmosférica de Vitoria-Gasteiz durante el período de estudio y la mortalidad a corto plazo 2) La asociación más consistente entre los indicadores de mortalidad analizados y los contaminantes estudiados (HN y SO<sub>2</sub>) la encontramos con los humos negros, durante el semestre frío y en personas susceptibles como los ancianos. 3) Sin embargo, esta relación no parece detectarse (según la medida de los captadores de la ciudad elegidos en el estudio) con niveles de humos negros inferiores a 80-90m g/m<sup>3</sup> y sí a partir de estos valores, lo que sugeriría la existencia de un umbral a partir del cual el contaminante tendría efectos en la mortalidad. </font></p> <b>      ]]></body>
<body><![CDATA[<p ALIGN="CENTER">&nbsp;</p>      <p ALIGN="CENTER"><font size="4">AGRADECIMIENTOS</font></b></p>      <p ALIGN="JUSTIFY"><font size="3">A Rosa Ruiz, del EUSTAT, y al Instituto Nacional de Meteorología por facilitar parte de los datos que fueron necesarios para la realización de este trabajo. A Mª Jesús Iturritxa por su ayuda en el análisis de las muestras de contaminantes. Y a los componentes de los grupos EMECAM de Barcelona y Valencia, en especial a Ferrán Ballester, por el estímulo y las sugerencias aportadas para llevar a cabo este proyecto.</font></p> <b>      <p ALIGN="CENTER">&nbsp;</p>      <p ALIGN="CENTER"><font size="4">BIBLIOGRAFÍA</font></p>      <!-- ref --><p></b><font size="3">1. Derrienic F, Richardson S, Mollie A, Lellouch J. Short term effects of sulphur dioxide pollution on mortality in two French cities. Int J Epidemiol 1989; 18: 186-97.</font><b>&nbsp;&nbsp;&nbsp;&nbsp;&nbsp;&nbsp;&nbsp;&nbsp;[&#160;<a href="javascript:void(0);" onclick="javascript: window.open('/scielo.php?script=sci_nlinks&ref=5575214&pid=S1135-5727199900020001900001&lng=','','width=640,height=500,resizable=yes,scrollbars=1,menubar=yes,');">Links</a>&#160;]<!-- end-ref --><!-- ref --><p></b><font size="3">2. Verhoeff AP, Hoek G, Schwartz J, Van Wijnen JH. Air pollution and daily mortality in Amsterdam. Epidemiol 1996; 7: 225-30.</font><b>&nbsp;&nbsp;&nbsp;&nbsp;&nbsp;&nbsp;&nbsp;&nbsp;[&#160;<a href="javascript:void(0);" onclick="javascript: window.open('/scielo.php?script=sci_nlinks&ref=5575215&pid=S1135-5727199900020001900002&lng=','','width=640,height=500,resizable=yes,scrollbars=1,menubar=yes,');">Links</a>&#160;]<!-- end-ref --><!-- ref --><p></b><font size="3">3. Touloumi G, Samoli E, Katsouyanni K. Daily mortality and &quot;winter type&quot; air pollution in Athens Greece - a time series analysis within the APHEA project. J Epidemiol Community Health 1996; 50(1 Suppl): 47S-51S.</font><b>&nbsp;&nbsp;&nbsp;&nbsp;&nbsp;&nbsp;&nbsp;&nbsp;[&#160;<a href="javascript:void(0);" onclick="javascript: window.open('/scielo.php?script=sci_nlinks&ref=5575216&pid=S1135-5727199900020001900003&lng=','','width=640,height=500,resizable=yes,scrollbars=1,menubar=yes,');">Links</a>&#160;]<!-- end-ref --><!-- ref --><p></b><font size="3">4. Zmirou D, Barumandzadeh T, Balducci F, Ritter P, Laham G, Ghilardi JP. Short term effects of air pollution on mortality in the city of Lyon, France, 1985-90. J Epidemiol Community Health 1996; 50 (1 Suppl): 30S-35S</font><b>&nbsp;&nbsp;&nbsp;&nbsp;&nbsp;&nbsp;&nbsp;&nbsp;[&#160;<a href="javascript:void(0);" onclick="javascript: window.open('/scielo.php?script=sci_nlinks&ref=5575217&pid=S1135-5727199900020001900004&lng=','','width=640,height=500,resizable=yes,scrollbars=1,menubar=yes,');">Links</a>&#160;]<!-- end-ref --><!-- ref --><p></b><font size="3">5. Wojtyniak B, Piekarski T. Short term effect of air pollution on mortality in Polish urban populations-what is different?. J Epidemiol Community Health 1996; 50 (1 Suppl): 36S-41S.</font><b>&nbsp;&nbsp;&nbsp;&nbsp;&nbsp;&nbsp;&nbsp;&nbsp;[&#160;<a href="javascript:void(0);" onclick="javascript: window.open('/scielo.php?script=sci_nlinks&ref=5575218&pid=S1135-5727199900020001900005&lng=','','width=640,height=500,resizable=yes,scrollbars=1,menubar=yes,');">Links</a>&#160;]<!-- end-ref --><!-- ref --><p></b><font size="3">6. Spix C, Wichmann HE. Daily mortality in Köln. J Epidemiol Community Health 1996; 50 (1 Suppl): 52S-58S.</font><b>&nbsp;&nbsp;&nbsp;&nbsp;&nbsp;&nbsp;&nbsp;&nbsp;[&#160;<a href="javascript:void(0);" onclick="javascript: window.open('/scielo.php?script=sci_nlinks&ref=5575219&pid=S1135-5727199900020001900006&lng=','','width=640,height=500,resizable=yes,scrollbars=1,menubar=yes,');">Links</a>&#160;]<!-- end-ref --><!-- ref --><p></b><font size="3">7. Sunyer J, Castellsagué J, Sáez M, Tobias A, Antó JM. Air pollution and mortality in Barcelona. J Epidemiol Community Health 1996; 50 (1 Suppl): 76S-80S.</font><b>&nbsp;&nbsp;&nbsp;&nbsp;&nbsp;&nbsp;&nbsp;&nbsp;[&#160;<a href="javascript:void(0);" onclick="javascript: window.open('/scielo.php?script=sci_nlinks&ref=5575220&pid=S1135-5727199900020001900007&lng=','','width=640,height=500,resizable=yes,scrollbars=1,menubar=yes,');">Links</a>&#160;]<!-- end-ref --><!-- ref --><p></b><font size="3">8. Ballester F, Corella D, Pérez-Hoyos S, Hervás A. Air pollution and mortality in Valencia, Spain: a study using the APHEA methodology. J Epidemiol Community Health 1996; 50: 527-33.</font><b>&nbsp;&nbsp;&nbsp;&nbsp;&nbsp;&nbsp;&nbsp;&nbsp;[&#160;<a href="javascript:void(0);" onclick="javascript: window.open('/scielo.php?script=sci_nlinks&ref=5575221&pid=S1135-5727199900020001900008&lng=','','width=640,height=500,resizable=yes,scrollbars=1,menubar=yes,');">Links</a>&#160;]<!-- end-ref --><!-- ref --><p></b><font size="3">9. Hoek G, Schwartz JD, Groot B, Eilers P. Effects of ambient particulate matter and ozone on daily mortality in Rotterdam, The Nederlands. Arch Environ Health 1997; 52:455-63.</font><b>&nbsp;&nbsp;&nbsp;&nbsp;&nbsp;&nbsp;&nbsp;&nbsp;[&#160;<a href="javascript:void(0);" onclick="javascript: window.open('/scielo.php?script=sci_nlinks&ref=5575222&pid=S1135-5727199900020001900009&lng=','','width=640,height=500,resizable=yes,scrollbars=1,menubar=yes,');">Links</a>&#160;]<!-- end-ref --><!-- ref --><p></b><font size="3">10. Anderson HR, Ponce de León A, Bland JM, Bower JS, Strachan DP. Air pollution and daily mortality in London: 1987-92. BMJ 1996; 312:665-9.</font><b>&nbsp;&nbsp;&nbsp;&nbsp;&nbsp;&nbsp;&nbsp;&nbsp;[&#160;<a href="javascript:void(0);" onclick="javascript: window.open('/scielo.php?script=sci_nlinks&ref=5575223&pid=S1135-5727199900020001900010&lng=','','width=640,height=500,resizable=yes,scrollbars=1,menubar=yes,');">Links</a>&#160;]<!-- end-ref --><!-- ref --><p></b><font size="3">11. Pérez-Hoyos S, Sáez M, Barceló MA, Cambra K, Figueiras A, Ordoñez JM et al. Protocolo EMECAM: análisis del efecto a corto plazo de la contaminación atmosférica sobre la mortalidad. Rev Esp Salud Publica 1998; 73:175-185.</font><b>&nbsp;&nbsp;&nbsp;&nbsp;&nbsp;&nbsp;&nbsp;&nbsp;[&#160;<a href="javascript:void(0);" onclick="javascript: window.open('/scielo.php?script=sci_nlinks&ref=5575224&pid=S1135-5727199900020001900011&lng=','','width=640,height=500,resizable=yes,scrollbars=1,menubar=yes,');">Links</a>&#160;]<!-- end-ref --><!-- ref --><p></b><font size="3">12. Ballester F, Sáez M, Alonso E, Taracido M, Ordoñez JM, Aguinaga I, et al. El proyecto EMECAM. Estudio multicéntrico español sobre la relación entre la contaminación atmosférica y la mortalidad. Antecedentes, participantes, objetivos, material y métodos. Rev Esp Salud Pública 1999; 73:165-173</font><b>&nbsp;&nbsp;&nbsp;&nbsp;&nbsp;&nbsp;&nbsp;&nbsp;[&#160;<a href="javascript:void(0);" onclick="javascript: window.open('/scielo.php?script=sci_nlinks&ref=5575225&pid=S1135-5727199900020001900012&lng=','','width=640,height=500,resizable=yes,scrollbars=1,menubar=yes,');">Links</a>&#160;]<!-- end-ref --><!-- ref --><p></b><font size="3">13. Katsouyanni K, Touloumi G, Spix C, Schwartz J, Balducci F, Medina S et al. Short term effects of ambient sulphur dioxide and particulate matter on mortality in 12 European cities: results from time series data from the APHEA project. BMJ 1997;314:1658-63.</font><b>&nbsp;&nbsp;&nbsp;&nbsp;&nbsp;&nbsp;&nbsp;&nbsp;[&#160;<a href="javascript:void(0);" onclick="javascript: window.open('/scielo.php?script=sci_nlinks&ref=5575226&pid=S1135-5727199900020001900013&lng=','','width=640,height=500,resizable=yes,scrollbars=1,menubar=yes,');">Links</a>&#160;]<!-- end-ref --><!-- ref --><p></b><font size="3">14. Committee of the environmental and occupational health assembly of the American Thoracic Society. Health effects of outdoor air pollution, Am J Respir Crit Care Med 1996; 153; 3-50.</font><b>&nbsp;&nbsp;&nbsp;&nbsp;&nbsp;&nbsp;&nbsp;&nbsp;[&#160;<a href="javascript:void(0);" onclick="javascript: window.open('/scielo.php?script=sci_nlinks&ref=5575227&pid=S1135-5727199900020001900014&lng=','','width=640,height=500,resizable=yes,scrollbars=1,menubar=yes,');">Links</a>&#160;]<!-- end-ref --> ]]></body><back>
<ref-list>
<ref id="B1">
<label>1</label><nlm-citation citation-type="journal">
<person-group person-group-type="author">
<name>
<surname><![CDATA[Derrienic]]></surname>
<given-names><![CDATA[F]]></given-names>
</name>
<name>
<surname><![CDATA[Richardson]]></surname>
<given-names><![CDATA[S]]></given-names>
</name>
<name>
<surname><![CDATA[Mollie]]></surname>
<given-names><![CDATA[A]]></given-names>
</name>
<name>
<surname><![CDATA[Lellouch]]></surname>
<given-names><![CDATA[J]]></given-names>
</name>
</person-group>
<article-title xml:lang="en"><![CDATA[Short term effects of sulphur dioxide pollution on mortality in two French cities]]></article-title>
<source><![CDATA[Int J Epidemiol]]></source>
<year>1989</year>
<volume>18</volume>
<page-range>186-97</page-range></nlm-citation>
</ref>
<ref id="B2">
<label>2</label><nlm-citation citation-type="journal">
<person-group person-group-type="author">
<name>
<surname><![CDATA[Verhoeff]]></surname>
<given-names><![CDATA[AP]]></given-names>
</name>
<name>
<surname><![CDATA[Hoek]]></surname>
<given-names><![CDATA[G]]></given-names>
</name>
<name>
<surname><![CDATA[Schwartz]]></surname>
<given-names><![CDATA[J]]></given-names>
</name>
<name>
<surname><![CDATA[Van Wijnen]]></surname>
<given-names><![CDATA[JH]]></given-names>
</name>
</person-group>
<article-title xml:lang="en"><![CDATA[Air pollution and daily mortality in Amsterdam]]></article-title>
<source><![CDATA[Epidemiol]]></source>
<year>1996</year>
<volume>7</volume>
<page-range>225-30</page-range></nlm-citation>
</ref>
<ref id="B3">
<label>3</label><nlm-citation citation-type="journal">
<person-group person-group-type="author">
<name>
<surname><![CDATA[Touloumi]]></surname>
<given-names><![CDATA[G]]></given-names>
</name>
<name>
<surname><![CDATA[Samoli]]></surname>
<given-names><![CDATA[E]]></given-names>
</name>
<name>
<surname><![CDATA[Katsouyanni]]></surname>
<given-names><![CDATA[K]]></given-names>
</name>
</person-group>
<article-title xml:lang="en"><![CDATA[Daily mortality and "winter type" air pollution in Athens Greece - a time series analysis within the APHEA project]]></article-title>
<source><![CDATA[J Epidemiol Community Health]]></source>
<year>1996</year>
<volume>50</volume>
<numero>^s1</numero>
<issue>^s1</issue>
<supplement>1</supplement>
<page-range>47S-51S</page-range></nlm-citation>
</ref>
<ref id="B4">
<label>4</label><nlm-citation citation-type="journal">
<person-group person-group-type="author">
<name>
<surname><![CDATA[Zmirou]]></surname>
<given-names><![CDATA[D]]></given-names>
</name>
<name>
<surname><![CDATA[Barumandzadeh]]></surname>
<given-names><![CDATA[T]]></given-names>
</name>
<name>
<surname><![CDATA[Balducci]]></surname>
<given-names><![CDATA[F]]></given-names>
</name>
<name>
<surname><![CDATA[Ritter]]></surname>
<given-names><![CDATA[P]]></given-names>
</name>
<name>
<surname><![CDATA[Laham]]></surname>
<given-names><![CDATA[G]]></given-names>
</name>
<name>
<surname><![CDATA[Ghilardi]]></surname>
<given-names><![CDATA[JP]]></given-names>
</name>
</person-group>
<article-title xml:lang="en"><![CDATA[Short term effects of air pollution on mortality in the city of Lyon, France, 1985-90]]></article-title>
<source><![CDATA[J Epidemiol Community Health]]></source>
<year>1996</year>
<volume>50</volume>
<numero>^s1</numero>
<issue>^s1</issue>
<supplement>1</supplement>
<page-range>30S-35S</page-range></nlm-citation>
</ref>
<ref id="B5">
<label>5</label><nlm-citation citation-type="journal">
<person-group person-group-type="author">
<name>
<surname><![CDATA[Wojtyniak]]></surname>
<given-names><![CDATA[B]]></given-names>
</name>
<name>
<surname><![CDATA[Piekarski]]></surname>
<given-names><![CDATA[T]]></given-names>
</name>
</person-group>
<article-title xml:lang="en"><![CDATA[Short term effect of air pollution on mortality in Polish urban populations-what is different?]]></article-title>
<source><![CDATA[J Epidemiol Community Health]]></source>
<year>1996</year>
<volume>50</volume>
<numero>^s1</numero>
<issue>^s1</issue>
<supplement>1</supplement>
<page-range>36S-41S</page-range></nlm-citation>
</ref>
<ref id="B6">
<label>6</label><nlm-citation citation-type="journal">
<person-group person-group-type="author">
<name>
<surname><![CDATA[Spix]]></surname>
<given-names><![CDATA[C]]></given-names>
</name>
<name>
<surname><![CDATA[Wichmann]]></surname>
<given-names><![CDATA[HE]]></given-names>
</name>
</person-group>
<article-title xml:lang="en"><![CDATA[Daily mortality in Köln]]></article-title>
<source><![CDATA[J Epidemiol Community Health]]></source>
<year>1996</year>
<volume>50</volume>
<numero>^s1</numero>
<issue>^s1</issue>
<supplement>1</supplement>
<page-range>52S-58S</page-range></nlm-citation>
</ref>
<ref id="B7">
<label>7</label><nlm-citation citation-type="journal">
<person-group person-group-type="author">
<name>
<surname><![CDATA[Sunyer]]></surname>
<given-names><![CDATA[J]]></given-names>
</name>
<name>
<surname><![CDATA[Castellsagué]]></surname>
<given-names><![CDATA[J]]></given-names>
</name>
<name>
<surname><![CDATA[Sáez]]></surname>
<given-names><![CDATA[M]]></given-names>
</name>
<name>
<surname><![CDATA[Tobias]]></surname>
<given-names><![CDATA[A]]></given-names>
</name>
<name>
<surname><![CDATA[Antó]]></surname>
<given-names><![CDATA[JM]]></given-names>
</name>
</person-group>
<article-title xml:lang="en"><![CDATA[Air pollution and mortality in Barcelona]]></article-title>
<source><![CDATA[J Epidemiol Community Health]]></source>
<year>1996</year>
<volume>50</volume>
<numero>^s1</numero>
<issue>^s1</issue>
<supplement>1</supplement>
<page-range>76S-80S</page-range></nlm-citation>
</ref>
<ref id="B8">
<label>8</label><nlm-citation citation-type="journal">
<person-group person-group-type="author">
<name>
<surname><![CDATA[Ballester]]></surname>
<given-names><![CDATA[F]]></given-names>
</name>
<name>
<surname><![CDATA[Corella]]></surname>
<given-names><![CDATA[D]]></given-names>
</name>
<name>
<surname><![CDATA[Pérez-Hoyos]]></surname>
<given-names><![CDATA[S]]></given-names>
</name>
<name>
<surname><![CDATA[Hervás]]></surname>
<given-names><![CDATA[A]]></given-names>
</name>
</person-group>
<article-title xml:lang="en"><![CDATA[Air pollution and mortality in Valencia, Spain: a study using the APHEA methodology]]></article-title>
<source><![CDATA[J Epidemiol Community Health]]></source>
<year>1996</year>
<volume>50</volume>
<page-range>527-33</page-range></nlm-citation>
</ref>
<ref id="B9">
<label>9</label><nlm-citation citation-type="journal">
<person-group person-group-type="author">
<name>
<surname><![CDATA[Hoek]]></surname>
<given-names><![CDATA[G]]></given-names>
</name>
<name>
<surname><![CDATA[Schwartz]]></surname>
<given-names><![CDATA[JD]]></given-names>
</name>
<name>
<surname><![CDATA[Groot]]></surname>
<given-names><![CDATA[B]]></given-names>
</name>
<name>
<surname><![CDATA[Eilers]]></surname>
<given-names><![CDATA[P]]></given-names>
</name>
</person-group>
<article-title xml:lang="en"><![CDATA[Effects of ambient particulate matter and ozone on daily mortality in Rotterdam, The Nederlands]]></article-title>
<source><![CDATA[Arch Environ Health]]></source>
<year>1997</year>
<volume>52</volume>
<page-range>455-63</page-range></nlm-citation>
</ref>
<ref id="B10">
<label>10</label><nlm-citation citation-type="journal">
<person-group person-group-type="author">
<name>
<surname><![CDATA[Anderson]]></surname>
<given-names><![CDATA[HR]]></given-names>
</name>
<name>
<surname><![CDATA[Ponce]]></surname>
<given-names><![CDATA[de León A]]></given-names>
</name>
<name>
<surname><![CDATA[Bland]]></surname>
<given-names><![CDATA[JM]]></given-names>
</name>
<name>
<surname><![CDATA[Bower]]></surname>
<given-names><![CDATA[JS]]></given-names>
</name>
<name>
<surname><![CDATA[Strachan]]></surname>
<given-names><![CDATA[DP]]></given-names>
</name>
</person-group>
<article-title xml:lang="en"><![CDATA[Air pollution and daily mortality in London: 1987-92]]></article-title>
<source><![CDATA[BMJ]]></source>
<year>1996</year>
<volume>312</volume>
<page-range>665-9</page-range></nlm-citation>
</ref>
<ref id="B11">
<label>11</label><nlm-citation citation-type="journal">
<person-group person-group-type="author">
<name>
<surname><![CDATA[Pérez-Hoyos]]></surname>
<given-names><![CDATA[S]]></given-names>
</name>
<name>
<surname><![CDATA[Sáez]]></surname>
<given-names><![CDATA[M]]></given-names>
</name>
<name>
<surname><![CDATA[Barceló]]></surname>
<given-names><![CDATA[MA]]></given-names>
</name>
<name>
<surname><![CDATA[Cambra]]></surname>
<given-names><![CDATA[K]]></given-names>
</name>
<name>
<surname><![CDATA[Figueiras]]></surname>
<given-names><![CDATA[A]]></given-names>
</name>
<name>
<surname><![CDATA[Ordoñez]]></surname>
<given-names><![CDATA[JM]]></given-names>
</name>
</person-group>
<article-title xml:lang="es"><![CDATA[Protocolo EMECAM: análisis del efecto a corto plazo de la contaminación atmosférica sobre la mortalidad]]></article-title>
<source><![CDATA[Rev Esp Salud Publica]]></source>
<year>1998</year>
<volume>73</volume>
<page-range>175-185</page-range></nlm-citation>
</ref>
<ref id="B12">
<label>12</label><nlm-citation citation-type="journal">
<person-group person-group-type="author">
<name>
<surname><![CDATA[Ballester]]></surname>
<given-names><![CDATA[F]]></given-names>
</name>
<name>
<surname><![CDATA[Sáez]]></surname>
<given-names><![CDATA[M]]></given-names>
</name>
<name>
<surname><![CDATA[Alonso]]></surname>
<given-names><![CDATA[E]]></given-names>
</name>
<name>
<surname><![CDATA[Taracido]]></surname>
<given-names><![CDATA[M]]></given-names>
</name>
<name>
<surname><![CDATA[Ordoñez]]></surname>
<given-names><![CDATA[JM]]></given-names>
</name>
<name>
<surname><![CDATA[Aguinaga]]></surname>
<given-names><![CDATA[I]]></given-names>
</name>
</person-group>
<article-title xml:lang="es"><![CDATA[El proyecto EMECAM. Estudio multicéntrico español sobre la relación entre la contaminación atmosférica y la mortalidad. Antecedentes, participantes, objetivos, material y métodos]]></article-title>
<source><![CDATA[Rev Esp Salud Pública]]></source>
<year>1999</year>
<volume>73</volume>
<page-range>165-173</page-range></nlm-citation>
</ref>
<ref id="B13">
<label>13</label><nlm-citation citation-type="journal">
<person-group person-group-type="author">
<name>
<surname><![CDATA[Katsouyanni]]></surname>
<given-names><![CDATA[K]]></given-names>
</name>
<name>
<surname><![CDATA[Touloumi]]></surname>
<given-names><![CDATA[G]]></given-names>
</name>
<name>
<surname><![CDATA[Spix]]></surname>
<given-names><![CDATA[C]]></given-names>
</name>
<name>
<surname><![CDATA[Schwartz]]></surname>
<given-names><![CDATA[J]]></given-names>
</name>
<name>
<surname><![CDATA[Balducci]]></surname>
<given-names><![CDATA[F]]></given-names>
</name>
<name>
<surname><![CDATA[Medina]]></surname>
<given-names><![CDATA[S]]></given-names>
</name>
</person-group>
<article-title xml:lang="en"><![CDATA[Short term effects of ambient sulphur dioxide and particulate matter on mortality in 12 European cities: results from time series data from the APHEA project]]></article-title>
<source><![CDATA[BMJ]]></source>
<year>1997</year>
<volume>314</volume>
<page-range>1658-63</page-range></nlm-citation>
</ref>
<ref id="B14">
<label>14</label><nlm-citation citation-type="journal">
<collab>Committee of the environmental and occupational health assembly of the American Thoracic Society</collab>
<article-title xml:lang="en"><![CDATA[Health effects of outdoor air pollution]]></article-title>
<source><![CDATA[Am J Respir Crit Care Med]]></source>
<year>1996</year>
<volume>153</volume>
<page-range>3-50</page-range></nlm-citation>
</ref>
</ref-list>
</back>
</article>
