


Meu SciELO
 Serviços customizados
Serviços Personalizados
Journal
Artigo
 texto em
  Inglês (pdf)
 Artigo em XML
 Referências do artigo
 Enviar este artigo por email
Indicadores
-
 Citado por SciELO
 -
 Acessos
Links relacionados
-
 Citado por Google
 -
 Similares em
SciELO
Similares em
SciELO -
 Similares em Google
Compartilhar

 Permalink
Revista de Osteoporosis y Metabolismo Mineral
versão On-line ISSN 2173-2345versão impressa ISSN 1889-836X
Rev Osteoporos Metab Miner vol.5 no.1 Madrid Jan./Mar. 2013
https://dx.doi.org/10.4321/S1889-836X2013000100004
PINP in patients with hepatic insufficiency: Comparison of two methods of measurement and association with different biochemical parameters
PINP en pacientes con insuficiencia hepática: Comparación de dos métodos de medida y asociación con diferentes parámetros bioquímicos
Guadalix S.1, Martínez-Conde L.2, Martínez Díaz-Guerra G.1, Vargas C.2, Hawkins F.1
1 Servicio de Endocrinología
2 Servicio de Bioquímica
Hospital Universitario 12 de Octubre - Madrid
SUMMARY
Introduction: N-terminal propeptide of type 1 collagen (PINP) is a marker for bone formation. Blood PINP is found in trimeric and monomeric forms. There are two automated methods for its determination. R-PINP (Roche Diagnostics) determines both forms (Total PINP). IDS-PINP (IDS iSYS N-Mid® Vitro) determines the trimeric part (Intact PINP).
Objective: To compare the two methods.
Material and method: 81 patients (64 men and 17 women, average age of 53 ± 8 years) with terminal hepatic insufficiency were recruited. Creatinine, PTH, 25-OH-vitamin D, beta-crosslaps (β-CTX), desoxypyridinoline (Dpyr), hepatic function and PINP with both methods, were measured. Bone mineral density (BMD) was measured (Hologic®, QDR 4500) in the lumbar spine and femoral neck. The comparison between the two methods was carried out using a Bland-Altman and Passing'Bablok analysis.
Results: R-PINP showed higher values than IDS-PINP (85.03 ± 56.67 vs. 55.22 ± 32.81 ng/mL, p<0,001). The correlation between the two methods was r= 0.81 (p<0.01) and the Passing-Bablok regression analysis Y = 0.570 [0.475-0.669] X + 7.724 [2.130-12.542].
Conclusion: There is a good correlation between the two methods in patients with hepatic insufficiency, although not proportional or interchangeable.
Key words: PINP, bone turnover markers, bone mineral density, liver insufficiency.
RESUMEN
Introducción: El propéptido N-terminal del colágeno tipo I (PINP) es un marcador de formación ósea. El PINP en suero se encuentra en forma trimérica y monomérica. Hay dos métodos automatizados para su determinación. R-PINP (Roche Diagnostics) determina ambas formas (PINP total). IDS-PINP (IDS iSYS N-Mid® Vitro) determina la fracción trimérica (PINP intacta).
Objetivo: Comparar ambos métodos.
Material y método: Se reclutaron 81 pacientes (64 hombres y 17 mujeres, edad media de 53 ± 8 años) con insuficiencia hepática terminal. Se midió PINP por ambos métodos, creatinina, PTH, 25-OH-vitamina D, beta-crosslaps (β-CTX), desoxipiridinolina (Dpyr) y la función hepática. Se midió la densidad mineral ósea (DMO) en columna lumbar y cuello femoral (Hologic®, QDR 4500). La comparación entre ambos métodos se realizó por análisis de Bland-Altman y Passing Bablok.
Resultados: R-PINP mostró valores mayores que IDS-PINP (85,03 ± 56,67 vs. 55,22 ± 32,81 ng/mL, p<0,001). La correlación entre ambos métodos fue r= 0,81 (p<0,01) y el análisis de regresión de Passing-Bablok Y= 0,570 [0,475-0,669] X + 7,724 [2,130-12,542].
Conclusión: Existe una buena correlación entre ambos métodos en pacientes con insuficiencia hepática, si bien no son proporcionales ni intercambiables.
Palabras clave: PINP, marcadores de remodelado óseo, densitometría ósea, insuficiencia hepática.
Introduction
The markers for bone remodelling (MBRs) provide information around the risk of fracture and may be useful in monitoring the treatment of osteoporosis, both with anti-resorptive drugs and anabolics [1]. The first markers for bone formation used were osteocalcin and alkaline phosphatase (AP). Both have various limitations. Osteocalcin can be produced by other tissues, circulate in intact and fragmented forms, its expression regulated by 1,25(OH)2 D3 and by the corticoids, is of limited value in patients with renal insufficiency and not very stable at room temperature [2]. With respect to AP, it may be affected by hepatic pathologies [3].
Type 1 collagen makes up 90% of bone protein and is synthesised as type 1 procollagen. In the extracellular processing of type 1 procollagen, the amino-terminal of type 1 collagen (PINP) and carboxy-terminal (PICP) fragments are released. These propeptides circulate in the blood and are used as markers for bone formation.
The pre-analytical advantages of PINP include low diurnal and inter-individual variability and stability at room temperature. It can be determined both in the blood and in the plasma, and, unlike other markers for bone resorption, its concentrations are not affected by the intake of food [4,5].
Currently, PINP is considered to be one of the markers for formation with the best clinical performance. Thus, it has been reported that in 14 patients, after the surgical menopause, PINP is the marker for bone formation which has the greatest diagnostic sensitivity, beating AP and osteocalcin [6]. The results reported in 51 patients with Paget's disease are similar, where a good correlation between the extension indices and the activity of the process was also observed [7].
There are two forms of PINP in the blood, intact or trimeric and monomeric [8]. The methods currently available measure the trimeric form (intact PINP) or the trimeric and monomeric forms (total PINP). There are few data published comparing the different methods of determining PINP, and even fewer in special populations, such as patients with chronic hepatopathy, candidates for liver transplant.
The aim of this study has been to compare two methods of automated determination of PINP: Cobas E 601, Roche Diagnostics (R-PINP) and IDS® Vitro (IDS- PINP) in patients with advanced chronic hepatopathy, candidates for liver transplant.
Material and method
The study included 81 patients with chronic advanced hepatopathy who were included on the waiting list for liver transplant of the 12th October University Hospital and studied in the clinic for bone metabolic diseases. The study was approved by the local ethics committee and carried out with the informed consent of all the patients. When the analyses were carried out the patients had received no treatment for their bone pathology. All the parameters analysed were determined using the same blood samples. The samples were taken in conditions of fasting and between 8.00 and 10.00 hours and stored at -70o C.
The analysis of total PINP (R-PINP) was carried out using an electro-chemoluminescence test using the ELECSYS 2010 (Roche diagnostics) equipment. This method detects the monomeric and trimeric forms (total). It has an analytical sensitivity <5,0 ng/mL. The intra- and inter-trial coefficients of variation (CV) vary between 2.3-3.7% and 1.8-2.9%, respectively. The normality range is 20 to 100 ng/mL. The analysis of the trimeric form of PINP (intact) (IDS-PINP) was carried out using automated chemoluminescence (IDS-iSYS). The intra- and inter-trial CVs vary between 2.6-3% and 4.2-5.3%, respectively. The normal values in adults are 27.7-127.6 ng/mL.
Also measured were: creatinine, glomerular fíltrate, blood MBR, beta-crosslaps (β-CTX) and urinary MBR desoxypyridinoline (Dpyr), parathormone (PTH), 25 hydroxyvitamin D (25-OH D3), and parameters for liver function (GOT, GPT, GGT, alkaline phosphatase, albumin and bilirubin). The calculation of glomerular filtrate was made using the formula CKD-EPI [9].
The marker β-CTX was determined by means of a sandwich type electro-chemiluminescence test using ELECSYS 1010 (Roche diagnostics) equipment. The intra- and intertrial CV is <4.1% and <5.7% respectively. The analytical sensitivity is 0.01 g/l. The normality range is from 0.20 to 0.70 ng/mL. The Dpyr analysis was carried out with a urine sample from the second micturation of the morning, performed using solid phase chemiluminescent immunoassay, using IMMULITE 2000 (SIEMENS) equipment. The results are expressed in nanomoles/litren(nM/l) of Dpyr and are normalised with reference to the excretion of urinary creatinine (mM/l). The analytical sensitivity is 6 nM/l of Dpyr. The method has a CV which varies between 2.5 and 11.8%. The normality range is from 2.3 to 7 nM-mM of creatinine.
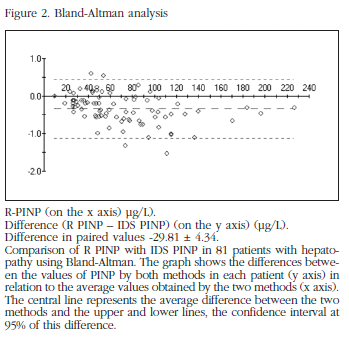
The bone mineral density (BMD) was measured in the spinal column and femoral neck (Hologic®, QDR 4500), the T-score being calculated in accordance with a Spanish population of similar age and sex [10]. Osteoporosis and osteopenia are defined in accordance with the criteria of the WHO [11].
Statistical analysis
The marker is transformed logarithmically to reduce its asymmetry. The comparison study of the measurement processes was carried out using a linear regression analysis with the Passing-Bablok method [12]. If two methods are comparable and give similar results, the 95% confidence interval of the incline ("a") should include the value 1 and the 95% confidence interval of the ordinate at the origin ("b") should include the value 0. If "a" does not include the value 1 there are proportional systematic errors. If "b" does not include the value 0 there will be constant systematic errors. The degree of agreement between the two methods is calculated using the Bland-Altman method [13]. The coefficients of correlation were calculated according to Pearson. The calculations were carried out using the statistical programme SPSS ((Statistical Package For Social Sciences, Waltham, USA) version 15.0 and CBstat (Statistical Analysis in Clinical Biochemistry) version 5.
Results
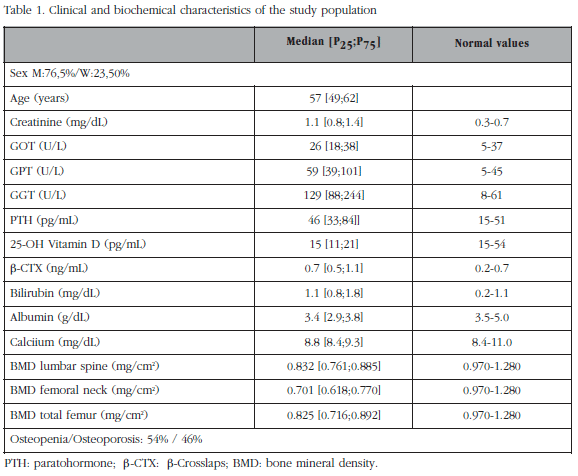
Table 1 summarises the characteristics of the population studied. 64 men and 17 women participated. The mean age was 53 ± 8 years. Of these patients, 44 (54%) had osteopenia and 37 (46%) densitometric osteoporosis. The values obtained with R-PINP were higher than the values of IDS-PINP (85 ± 56.7 vs 55.2 ± 32.8 ng/mL, p<0.001), according to the methodology (total vs intact PINP). The coefficient of correlation between the two methods was r= 0.81 (p<0.01). The Passing-Bablok regression analysis (Figure 1) showed that the 95% confidence interval of the incline did not include 1: a= 0.570 (0.475; 0.669) and that the 95% confidence interval of the ordinate at the origin does not include 0: b= 7.724 (2.130; 12.542); therefore there are proportional and constant systematic errors.
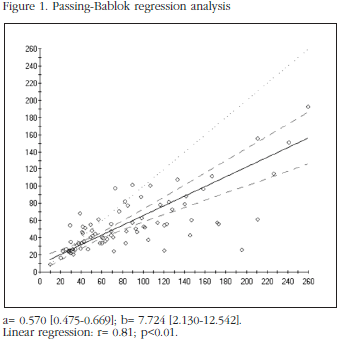
The difference of paired values (Bland Altman analysis) was -29.81 ± 4.34 (Figure 2). Correlations were found between R-PINP and creatinine (r= 0.36; p<0.01), R-PINP and β-CTX (r= 0.26 ; p<0.021) and between R-PINP and 25-OH D3 (r= -0.27 ; p<0.017). The Dpyr showed a significant correlation with both R-PINP and IDS-PINP (r= 0.29 ; p<0.007). No correlation was found between PINP and the values of PTH, BMD (in any position) and parameters for liver function in either of the two methods.
A tendency to an increase in the difference between the two methods was observed, with high concentrations of PINP, as can be seen in Figure 1, as with the analysis of the ranges: R-PINP (9.4-259.2 g/mL). IDS-PINP (9.5-192.6 ng/mL). With values of PINP < 70 ng/mL, the comparison of the methods of R-PINP and IDS-PINP did not show any proportional systematic errors: a= 0.7973 (CI 95%: 0.6015 ; 1.1011), or constant systematic errors: b= 2.0609 (CI 95%: -7.4225 ; 8.4048).
In studying both methods classifying patients according to whether they had osteopenia (n= 44) or osteoporosis (n= 37), no significant differences were found in the values of intact or total PINP between them. However, it was observed that in patients with osteoporosis there is higher agreement between the two methods, there being neither proportional or constant systematic errors, as can be seen in the values of the incline and the ordinate at the origin obtained by Passing Bablok:
- Patients with osteopenia: a= 0.4583 (CI 95% : 0.3065 ; 0.6502), b= 14.679 (CI 95% : 3.4471 ; 21.2231).
- Patients with osteoporosis: a= 0.7062 (CI 95%: 0.4292 ; 1.2244), b= -5.9053 (CI 95% :-39.4974 ; 10.4624).
In classifying the patients according to renal function a better association between the two methods was observed when the renal function was normal. In patients with glomerular filtrate > 60 ml/min/1.73m2 (n= 33) ) no proportional systematic errors: a= 0.7007 (CI 95%: 0.4912 ; 1.0137), or constant systematic errors: b= 5.5611 (CI 95% : -7.2525 ; 14.3792) were found. However, in patients with glomerular filtrate <60 ml/m2 (n= 48), in/1.73m proportional systematic errors were found: a= 0.5540 (CI 95% : 0.4391 ; 0.6563), but no constant systematic errors: b= 5.5698 (CI 95% : -4.4497 ; 13.1874).
Discussion
The use of MBRs in the management of bone metabolic pathology has increased notably in recent years. For example, recently the International Foundation for Osteoporosis and the International Federation of Clinical Chemistry and Medicine Laboratories have recommended the determination of blood PINP as the marker for bone formation of choice [14]. In this work two methods for the determination of PINP (total and intact forms) in patients with advanced chronic hepatopathy with osteopenia or osteoporosis were compared. Our data show that there is a good correlation between the two methods, although there is no direct transferability between the two results, since neither zero in the ordinate at the origin nor one in the incline of the regression line are included. There are few studies which compare different methods for determining PINP. It is not well established to what extent two forms of PINP circulating in the blood are recognized by the different methods. The clearing of intact PINP is characterised by a rapid capture by the hepatic endothelial cells, while the monomeric forms depend to a great degree on the renal function.
Koivula et al. [15] studied a manual method for intact PINP (RIA, Orion Diagnostics) as against the R-PINP method. The correlation between them in healthy subjects was 0.89, similar to that found in our study, and while the concentrations of PINP were similar between the two methods, this was in spite of the fact that one determined the intact form, and the other the total form.
The reason why we observed a greater difference between R-PINP and IDS-PINP as the value of PINP increases is unclear. Other authors have found similar results when comparing methods for the determination of PINP using RIA vs automated methods based on chemiluminescence. These authors make reference to a possible ceiling effect in using RIA at high concentrations of PINP, which could justify the difference between the two methods at these concentrations [15].
We found a weak significant correlation between the blood marker for resorption β-CTX and R-PINP, but not IDS-PINP, possibly because this only measures the trimeric form. However, the urinary marker for resorption, Dpyr, was correlated with both methods. Also found was a negative correlation between levels of 25-OH D3 and the value of R-PINP, which may be due to the influence of the status of vitamin D in remodelled bone.
The data found with respect to the positive correlation between creatinine and R-PINP are similar to those referred to by other authors. In healthy subjects, total and intact PINP show similar results, but in patients with chronic renal insufficiency the results differ. The increase is due to an increase in the monomeric forms, which accumulate in the blood of patients with renal insufficiency [16-18]. In patients in haemodialysis with terminal renal insufficiency, although the PINP showed an initial increase during the haemodialysis, at the end of the sessions no significant changes in intact or total PINP were observed [19-21].
Changes in MBR may be useful in monitoring treatment of osteoporosis, confirming therapeutic compliance and evaluating the efficacy of treatment[8]. In those patients with terminal hepatic insufficiency after transplant the use of bisphosphonates is indicated [22-24]. The values of PINP found do not appear to be affected by the hepatopathy, since they do not correlate with parameters for hepatic function in this group of patients with hepatic insufficiency who have not yet received post-transplant immunosuppressive, or anti-resorptive, treatment. We do not know if either method would be sensitive enough to detect in a comparable way the changes in bone remodelling which occur after hepatic transplant [25] and with anti-osteoporotic treatment [22-24]. Garnero et al. show that R-PINP, in comparison with manual RIA (intact PINP), detected an increase in bone remodelling in postmenopausal women and was sensitive enough to detect significant changes in bone remodelling induced by treatment with PTH 1-84 and with alendronate.
In summary, while we found a good correlation between the two methods of determining PINP (total and intact forms), there are differences which mean that their results are not consistent.
![]() Correspondence:
Correspondence:
Sonsoles Guadalix Iglesias
Hospital Universitario 12 de Octubre
Servicio Endocrinología
Centro Actividades Ambulatorias (3a B)
Avda. de Córdoba, s/n
28041 Madrid (Spain)
e-mail:
sonsoguadalix@gmail.com
Date of receipt: 08/02/2013
Date of acceptance: 18/03/2013
Bibliography
1. Bonnick SL, Shulman L. Monitoring osteoporosis therapy: bone mineral density, bone turnover markers, or both? Am J Med 2006;119:S25-31. [ Links ]
2. Garnero P, Grimaux M, Seguin P, Delmas PD. Characterization of immunoreactive forms of human osteocalcin generated in vivo and in vitro. J Bone Miner Res 1994;9:255-4. [ Links ]
3. Garnero P, Delmas PD. Assessment of the serum levels of bone alkaline phosphatase with a new immunoradiometric assay in patients with metabolic bone disease. J Clin Endocrinol Metab 1993;77:1046-53. [ Links ]
4. Lee J, Vasikaran S. Current recommendations for laboratory testing and use of bone turnover markers in management of osteoporosis. Ann Lab Med 2012;32:105-12. [ Links ]
5. Clowes JA, Hannon RA, Yap TS, Hoyle NR, Blumsohn A, Eastell R. Effect of feeding on bone turnover markers and its impact on biological variability of measurements. Bone 2002;30:886-90. [ Links ]
6. Peris P, Álvarez L, Monegal A, Guañabens N, Durán M, Pons F, et al. Biochemical markers of bone turnover after surgical menopause and hormone replacement therapy. Bone 1999;25:349-53. [ Links ]
7. Álvarez L, Peris P, Pons F, Guañabens N, Herranz R, Monegal A, et al. Relationship between biochemical markers of bone turnover and bone scintigraphic indices in assessment of Paget's disease activity. Arthritis Rheum 1997;40:461-8. [ Links ]
8. Brown JP, Albert C, Nassar BA, Adachi JD, Cole D, Davison KS, et al. Bone turnover markers in the management of postmenopausal osteoporosis. Clin Biochem 2009;42:929-42. [ Links ]
9. Levey AS, Stevens LA, Schmid CH, Zhang YL, Castro AF 3rd, Feldman HI, et al. CKD-EPI (Chronic Kidney Disease Epidemiology Collaboration). A new equation to estimate glomerular filtration rate. Ann Intern Med 2009;150:604-12. [ Links ]
10. Díaz Curiel M, Carrasco de la Peña JL, Honorato Pérez J, Pérez Cano R, Rapado A, Ruiz Martínez I. Study of bone mineral density in lumbar spine and femoral neck in a Spanish population. Multicentre Research Project on Osteoporosis. Osteoporos Int 1997;7:59-64. [ Links ]
11. World Health Organization Scientific Group Research on Menopause. (1998) WHO Technical Service Report Series 670, WHO Geneva. [ Links ]
12. Passing H, Bablok W. A new biometrical procedure for testing the equality of measurements from two different analytical methods. J Clin Chem Clin 1983;21:709-20. [ Links ]
13. Bland JM, Altman DG. Statistical methods for assessing agreement between two methods of clinical measurement. Lancet 1986;1:307-10. [ Links ]
14. Vasikaran S, Cooper C, Eastell R, Griesmacher A, Morris HA, Trenti T, et al. International Osteoporosis Foundation and International Federation of Clinical Chemistry and Laboratory Medicine. Position on bone marker standards in osteoporosis. Clin Chem Lab Med 2011;24:1271-4. [ Links ]
15. Koivula MK, Ruotsalainen V, Björkman M, Nurmenniemi S, Ikäheimo R, Savolainen K, et al. Difference between total and intact assays for N-terminal propeptide of type I procollagen reflects degradation of pN-collagen rather than denaturation of intact propeptide. Ann Clin Biochem 2010;47:67-71. [ Links ]
16. Melkko J, Kauppila S, Niemi S, Risteli L, Haukipuro K, Jukkola A, et al. Immunoassay for intact amino-terminal propeptide of human type I procollagen. Clin Chem 1996;42:947-54. [ Links ]
17. Koivula MK, Richardson J, Leino A, Valleala H, Griffiths K, Barnes A, et al. Validation of an automated intact N-terminal propeptide of type I procollagen (PINP) assay. Clin Biochem 2010;43:1453-7 [ Links ]
18. Garnero P, Vergnaud P, Hoyle N. Evaluation of a fully automated serum assay for total N-terminal propeptide of type I collagen in postmenopausal osteoporosis. Clin Chem 2008;54:188-96. [ Links ]
19. Ueda M, Inaba M, Okuno S, Nagasue K, Kitatani K, Ishimura E, et al. Clinical usefulness of the serum N-terminal propeptide of type I collagen as a marker of bone formation in hemodialysis patients. Am J Kidney Dis 2002;40:802-9. [ Links ]
20. Álvarez L, Torregrosa JV, Peris P, Monegal A, Bedini JL, Martínez de Osaba MJ, et al. Effect of hemodialysis and renal failure on serum biochemical markers of bone turnover. J Bone Miner Metab 2004;22:254-9. [ Links ]
21. Koivula MK, Riseli L, Riseli J. Measurement of aminoterminal propeptide of type I procollagen (PINP) in serum. Clin Biochem 2012;45:920-7. [ Links ]
22. Gilfraguas L, Guadalix S, Martínez G, Jodar E, Vara J, Gómez-Sánchez MA, et al. Bone loss after heart transplant: effect of alendronate, etidronate, calcitonin, and calcium plus vitamin D3. Prog Transplant 2012;22:237-43. [ Links ]
23. Guadalix S, Martínez-Díaz-Guerra G, Lora D, Vargas C, Gómez-Juaristi M, Cobaleda B, et al. Effect of early risedronate treatment on bone mineral density and bone turnover markers after liver transplantation: a prospective single-center study. Transpl Int 2011;24: 657-65. [ Links ]
24. Valero MA, Loinaz C, Larrodera L, Leon M, Moreno E, Hawkins F. Calcitonin and bisphosphonates treatment in bone loss after liver transplantation. Calcif Tissue Int 1995;57:15-9. [ Links ]
25. Hawkins FG, Leon M, López MB, Valero MA, Larrodera L, García-García I, et al. Bone loss and turnover in patients with liver transplantation. Hepatogastroenterology 1994; 41:158-61. [ Links ]

