


 Servicios personalizados
 Inglés (pdf)
 Articulo en XML
 Referencias del artículo
 Enviar articulo por email
 Citado por SciELO
  Citado por Google
  Similares en
SciELO
Similares en
SciELO  Similares en Google
 Permalink
INTRODUCTION
Resistin is a well-known adipokine that it is related initially to insulin resistance in animal models (1). It is secreted by adipocytes and macrophages in adipose tissue. Adipose tissue has a role of energy storage but it is also an endocrine organ when synthesizing many adipokines. These adipokines have important roles in metabolism, insulin sensitivity, inflammatory status, satiety and appetite (2), and one of them is the above-mentioned resistin. Circulating resistin levels have been associated with increased central obesity (3), metabolic syndrome (4) and type 2 diabetes mellitus (5). However, other studies have failed to demonstrate these associations (6).
Heritability of resistin levels has been described (7), and a high percentage of the variation in circulating resistin levels can be explained by genetic factors. The gene encoding resistin (RETN) is located in chromosome 19p13.2, and some genetic variants have been described in this locus (8,9). For example, single nucleotide polymorphisms (SNPs) of this gene and in decorin gene (DC) have been reported to increase diabetes mellitus type 2 susceptibility by increasing resistin levels (10,11). One of these SNPs is rs3138167 and it has been poorly evaluated. The SNP 5’ UTR C/T intron variant (rs3138167) is a polymorphism associated with elevated resistin levels (12). Despite this previous data in cross-sectional studies, there are no investigations in the literature that evaluate the effect of rs3138167 on metabolic changes after weight loss with a diet. One of the dietary patterns with the greatest beneficial effect on biochemical parameters after weight loss is the Mediterranean diet pattern (13). The Mediterranean diet pattern has demonstrated a lot of cardiometabolic improvements such as improvement of insulin resistance or lipid profile (14). Some studies with other SNPs have shown different metabolic responses to dietary interventions (15), and even after bariatric surgery (16).
Our aim was to analyze the effects of the rs3138167 polymorphism on metabolic changes secondary to weight loss after a hypocaloric diet with a Mediterranean pattern.
PATIENTS AND METHODS
SUBJECTS
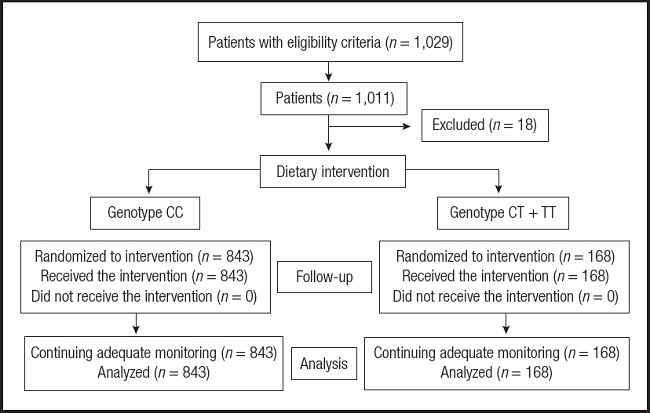
A sample of 1,029 obese (body mass index [BMI] ≥ 30 kg/m2) non-diabetic Caucasian adult outpatients was recruited and a total of 1,011 subjects were analyzed (Fig. 1). These patients were enrolled in a prospective way with a consecutive method of sampling among patients from Primary Care physicians with obesity. This design was realized according to the Declaration of Helsinki and all procedures were passed by the Ethics Central Committee of Hospital Clínico Universitario de Valladolid (HCUVa). All participants signed an informed consent to a protocol approved by the local ethical review boards.
For the inclusion of these patients, the following criteria were used: age over 18 years, BMI over 30 and absence of a diet during the three months previous to the study. The following criteria were used as exclusion criteria: cardiovascular events during the previous 12 months, history of hypertension or dyslipidemia or diabetes mellitus, as well as the use of metformin, sulphonylurea, dipeptidyl type IV inhibitor drugs, thiazolidinediones, insulin, glucocorticoids, angiotensin receptor blockers, angiotensin converting enzyme inhibitors, psychoactive medications, statins and other lipid drugs.
PROCEDURES
Fasting (12 hours) venous blood samples were obtained by venipuncture and collected in Vacutainer™ tubes. Basal fasting glucose, C-reactive protein (CRP), insulin, insulin resistance (HOMA-IR), lipid profile (total cholesterol, LDL-cholesterol, HDL-cholesterol, plasma triglycerides concentration) and circulating adipokine levels (leptin, adiponectin and resistin) were determined within the basal time of the trial and repeated after 12 weeks of follow-up. In the two times of the study previously commented, the following parameters were determined: fat mass with impedance, weight and blood pressure. rs3138167 variant of RETN gene was evaluated at basal time.
GENOTYPING OF RS3138167 GENE POLYMORPHISM
Genomic DNA was obtained from peripheral blood leukocytes with the commercial Vineo Extract DNA kit (Biorad, Los Angeles, California, United States) according to the manufacturer’s protocol. The real-time polymerase chain reaction (PCR) was carried out with 50 ng of this genomic DNA, 0.5 ul of 100 μM of each oligonucleotide primer (primer forward: 5’- ACGTTGGATGTTAAGAAGAGTAGCACTGCC -3 ‘and reverse 5’- ACGTTGGATGTCTCTGTGCTCACTGTATTG -3’). The DNA was denatured at 95 °C for three minutes; 45 denaturation cycles were performed at 95 °C for 15 seconds, and subsequently, at 59.3 °C for 45 seconds. PCR was performed in a final volume of 25 μl containing 12.5 μl of IQ™ Supermix (Bio-Rad®, Hercules, California, United States) with TAq DNA polymerase. If both strands grew in the sample, this sample was classified as heterozygous. If only one strand grew in a sample, this sample was classified as homozygous. The thermal cycler software classifies each subject as homozygous wild type (CC), heterozygous (CT), and homozygous mutant (TT). Moreover, a negative control and control samples representing all genotypes were included in each reaction. Hardy-Weinberg equilibrium was determined with a statistical test (Chi-squared). The variant of RETN gene was in Hardy-Weinberg equilibrium (p = 0.43).
LABORATORY DETERMINATIONS
Serum biochemistry analysis for glucose, insulin, CRP, total cholesterol, HDL-cholesterol, and triglyceride levels was measured using the COBAS INTEGRA® 400 analyzer (Roche Diagnostic, Basel, Switzerland). LDL cholesterol was calculated using Friedewald formula (LDL cholesterol = total cholesterol - HDL cholesterol-triglycerides / 5) (17). Based on glucose and insulin levels, homeostasis model assessment for insulin resistance (HOMA-IR) was obtained using the next equation (glucose x insulin / 22.5) (18). Finally, all adipokine levels were determined by enzyme-linked immunosorbent assay (ELISA): resistin (Biovendor Laboratory, Inc., Brno, Czech Republic) with a sensitivity of 0.2 ng/ml with a normal range of 4-12 ng/ml (19), leptin (Diagnostic Systems Laboratories, Inc., Texas, United States) with a sensitivity of 0.05 ng/ml and a normal range of 10-100 ng/ml (20) and adiponectin (R&D systems, Inc., Minneapolis, United States) with a sensitivity of 0.246 ng/ml and a normal range of 8.65-21.43 ng/ml.
BLOOD PRESSURE AND ANTHROPOMETRIC PARAMETERS
Blood pressure was measured three times after a ten-minute rest time with a mercury sphygmomanometer (Omrom, Los Angeles, California, United States) and the results were averaged. Body weight was measured with a scale with a precision of 100 g (Omrom, Los Angeles, California, United States), and BMI was calculated as weight (kg) / height (m2), classifying as obese patients with a BMI greater than 30 kg/m2. The waist circumference (WC) was also measured with a measuring tape (Type SECA, SECA, Birmingham, United Kingdom) (narrowest diameter between the xiphoid process and the iliac crest). Total fat mass was obtained by impedance with an accuracy of 5 g (EFG BIA 101 Anniversary, Akern, Italy) (21). The following formula was used: (0.756 height2/resistance) + (0.110 x body mass) + (0.107 x reactance) - 5.463.
DIETARY CHANGE
During this interventional study (12 weeks), subjects received individualized counseling on a hypocaloric diet with a Mediterranean profile. This caloric intake was calculated by subtracting 500 calories from the caloric intake obtained with the Harris-Benedict formula in our obese population (2,039.4 ± 93.7 kcal per day). The ratio of nutrients in the diet was as follows: 25 % from lipids, 23 % from proteins and the main nutrient was 52 % from carbohydrates. The range of fats was: 50.7 % of monounsaturated dietary fats, 38.5 % of saturated dietary fats and 11.8 % of polyunsaturated dietary fats. The diet contained the following foods: extra-virgin olive oil (an amount of 30 ml/day) (OliDuero, Matarromera, S.L.), three portions of fish per each week, three servings of nuts per week, and 4-5 portions of vegetables and fresh fruits each day. The monitoring of the dietary intervention was performed each two weeks by a dietitian. All subjects received briefing to impress their intakes for three different days. Records were evaluated by a registered dietitian with a computer program (22). The recommended physical exercise program consisted of aerobic exercise at least three times per week (60 minutes each, reaching a total of 180 minutes per week) and the patient recorded it with a self-reported questionnaire.
STATISTICAL ANALYSIS
Sample size was realized to detect differences over 1 ng/ml in circulating resistin levels after diets with 90 % power and 5 % significance (n = 1,000). The Kolmogorov-Smirnov test was used to determine variable distribution. The data were reported as average ± standard deviation. Numerical variables with normal distribution were analyzed with a two-tailed Student’s t-test. Categorical variables were evaluated with the Chi-squared test, with Yates correction as necessary. Non-parametric variables were analyzed with the Mann-Whitney U test. The differences in anthropometric and biochemical variables between the genotype groups were tested with analysis of the covariance (ANCOVA) adjusted age and sex. The statistical analysis was performed for the combined CT and TT genotypes as a group (risk genotype) and CC genotype as second group (wild genotype), in a dominant model. A p-value < 0.05 was considered as statistically significant. All analyses were carried out using SPSS version 23.0 (Illinois, United States).
RESULTS
One thousand and twenty-nine patients signed an informed consent and were enrolled in the dietary intervention trial. One thousand and eight patients received dietary intervention and completed the 12-week follow-up period (Fig. 1). The mean age was 47.3 ± 4.3 years and the mean BMI was 36.2 ± 2.3, with 271 males (26.9 %) and 737 females (73.1 %). Eight hundred and forty-three patients (83.4 %) had the genotype CC (major allele group) and 168 (16.6 %) patients had the next genotypes groups; CT (165 patients, 16.3 %) or TT (three patients, 0.3 %) (minor allele group). Hardy-Weinberg equilibrium was assessed with the Chi-squared test to compare our expected and observed counts. This genetic variant was in Hardy-Weinberg equilibrium (p = 0.43).
No differences were detected in average ages between genotype groups (major allele group: 47.8 ± 2.9 years vs minor allele group: 47.1 ± 4.3 years; ns). Sex distribution was similar in both genotype groups, males (27.6 % vs 23.4 %) and females (72.4 % vs 76.6 %), too. Patients followed the dietary recommendations and in both genotype groups patients reached the targets. The total caloric amount was similar in both genotype groups (CC vs CT + TT) (1,543.1 ± 192.2 vs 1,496.1 ± 210.1 calories/day; ns). The percentage of macronutrient in both groups (CC vs CT + TT) was similar: carbohydrates = 35.8 ± 3.1 vs 36.2 ± 2.7 % (p = 0.21); fats = 41.0 ± 3.1 vs 41.1 ± 2.8 % (p = 0.22); and proteins = 23.2 ± 2.3 vs 22.7 ± 1.9 %; (p = 0.13), too. The distribution of dietary fats in both genotype groups (CC vs CT + TT) was similar: monounsaturated fats = 60.3 ± 4.0 vs 59.9 ± 4.4 % (p = 0.42); saturated fats = 24.7 ± 3.0 vs 25.1 ± 2.8 % (p = 0.30); and polyunsaturated fats = 16.0 ± 1.0 vs 15.0 ± 1.3 % (p = 0.13), too.
The changes in adiposity parameters and levels of blood pressure are reported in table I. After the hypocaloric diet with a Mediterranean pattern, the next parameters decreased: weight, BMI, fat mass, systolic blood pressure and WC. These improvements were similar in both genotype groups, without statistical differences. In the CC group, the decrease in weight was -4.1 ± 1.1 kg (decrease in T allele carriers: -4.0 ± 1.2 kg; p = 0.43), BMI -1.0 ± 0.3 kg/m2 (decrease in T allele carriers: -0.9 ± 0.3 kg/m2; p = 0.41), fat mass -3.1 ± 1.0 kg (decrease in T allele carriers: -3.0 ± 1.0 kg; p = 0.34) and WC -8.6 ± 2.1 cm (decrease in T allele carriers: -7.6 ± 2.1 cm; p = 0.31). In non-T allele carriers, the decrease in systolic blood pressure was -4.4 ± 1.9 mmHg (decrease in T allele carriers: -5.1 ± 2.1 mmHg; p = 0.28). Therefore, the improvement of all the previously mentioned parameters was similar in carriers and non-carriers of the T allele. No differences were detected in diastolic blood pressure after dietary intervention. Finally, no differences were detected among basal and post-treatment values of anthropometric parameters between both genotype groups CC vs CT/TT. An additional analysis was carried out in anthropometry, dichotomizing the variable WC (elevated: men > 102 cm and women > 88 cm), showing a similar percentage in elevated values before the dietary intervention (CC vs CT + TT) (47.4 % vs 46.4 %; p = 0.43) and after the dietary intervention (35.8 % vs 34.5 %; p = 0.56).
Table I. Basal and post-intervention anthropometric parameters of obesity and blood pressure measurement (mean ± SD).
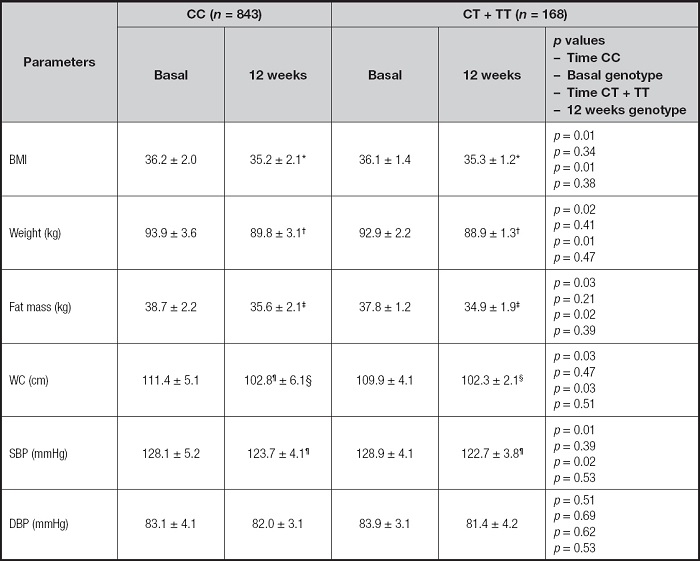
BMI: body mass index; DBP: diastolic blood pressure; SBP: systolic blood pressure; WC: waist circumference. Statistical differences p < 0.05, in each genotype group (*BMI, †weight, ‡fat mass, ¦WC, ¶SBP). First p, significance of dietary intervention after 12 weeks in CC genotype; second p, significance between CC genotypes vs CT + TT baseline values; third p, significance of dietary intervention after 12 weeks in CT + TT genotype; and fourth p, significance between CC genotypes vs CT + TT post-treatment.
Biochemical parameters are reported in table II. The decrease in biochemical variables was not significant in patients with the T allele. In non-T allele carriers, insulin, HOMA-IR, triglycerides and CRP levels decreased. The decrease of these parameters in non-T allele carriers was statistically significant; triglycerides (-18.3 ± 4.3 mg/dl; p = 0.02), CRP (-2.6 ± 0.3 mg/dl; p = 0.02), insulin (-4.4 ± 1.9 mUI/l; p = 0.02) and HOMA-IR (-2.1 ± 0.7; p = 0.03). Therefore, the improvement of all the previously mentioned parameters was statistically superior in non-carriers of the T allele than in non-T allele carriers. Finally, statistical differences in insulin and HOMA-IR were detected among basal and post-treatment values of variables between major allele genotype CC and minor allele genotype (CT + TT). The values of these parameters were higher in T allele carriers than in non-T allele carriers.
Table II. Basal and post-intervention levels biochemical parameters (mean ± SD).
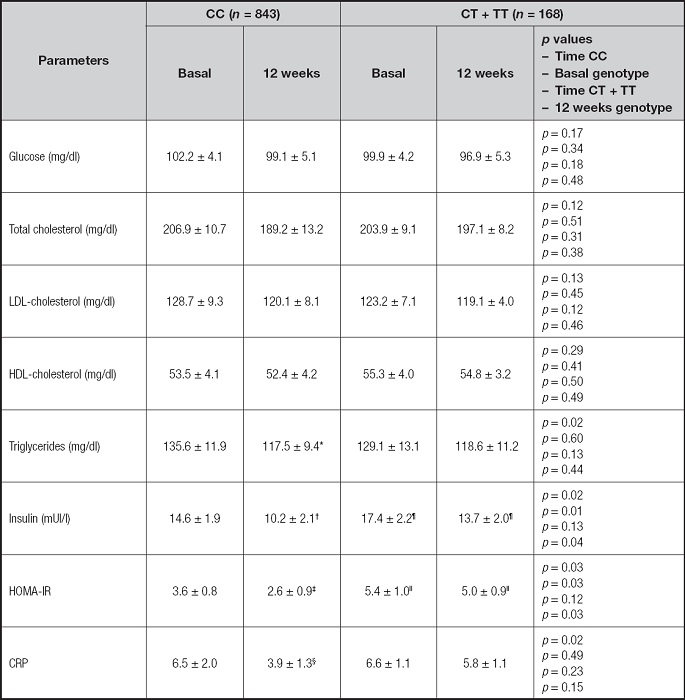
HOMA-IR: homeostasis model assessment; CRP: C-reactive protein. Statistical differences p < 0.05, in each genotype group (*triglycerides, †insulin, ‡HOMA IR, ¦CRP). Statistical differences p < 0.05, in different genotype groups (¶insulin, IIHOMA-IR). First p, significance of dietary intervention after 12 weeks in CC genotype; second p, significance between CC genotypes vs CT + TT baseline values; third p, significance of dietary intervention after 12 weeks in CT + TT genotype; and fourth p, significance between CC genotypes vs CT + TT post-treatment values.
Table III reports changes of circulating adipokines. Leptin levels decrease in both genotype groups after dietary intervention (-22.3 ± 4.5 ng/dl in non-T allele carriers vs -18.0 ± 4.2 ng/dl in T allele carriers; p = 0.45). Resistin levels decrease in non-T allele carriers after dietary intervention (-1.2 ± 0.2 ng/dl in non-T allele carriers vs -0.6 ± 0.1 ng/dl in T allele carriers; p = 0.02). Adiponectin levels remained unchanged in both groups. Differences in resistin levels were detected among basal and post-treatment between both genotype groups CC vs CT/TT. The values of resistin were higher in T allele carriers than in non-T allele carriers.
Table III. Basal and post-intervention levels of serum adipokines (mean ± SD).
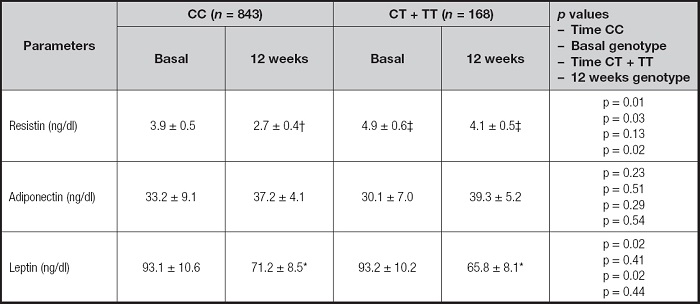
Statistical differences p < 0.05, in each genotype group (*leptin, †resistin). Statistical differences p < 0.05, in different genotype groups (‡resistin). First p, significance of dietary intervention after 12 weeks in CC genotype; second p, significance between CC genotypes vs CT + TT baseline values; third p, significance of dietary intervention after 12 weeks in CT + TT genotype; and fourth p, significance between CC genotypes vs CT + TT post-treatment values.
DISCUSSION
As far as we know, this is the first interventional study that analyzes the effects of a hypocaloric diet and variant rs3138167 on metabolic response after a significant weight loss. In our study analyzing this genetic variant, we have observed a significant association between T allele of this SNP and worse response of insulin resistance, triglycerides, CRP and circulating resistin than in non-T allele carriers after weight loss with a hypocaloric Mediterranean diet.
The role of resistin on metabolism is controversial. Some authors have observed that resistin levels were related to obesity and its comorbidities (23) and other studies did not report these associations (24,25). On the other hand, the effect on resistin levels of dietary or other interventions that produce weight loss are also scarce and contradictory. There are studies with hypocaloric diets (15) in which the levels of resistin have not changed. Other dietary interventions studies have demonstrated a decrease of resistin levels after weight loss (26) or even an increase of serum levels after weight loss (27). The biological response of resistin is complex since after adjustable gastric banding, a biphasic response with a decrease in resistin levels initially and an increase at 12 months of follow-up have been reported (28).
Different nutrients present in the diet and also genetic variants may be involved in these observed responses. For example, Cabrera et al. (29) showed that resistin level is positively associated with saturated fat intake and inversely associated with monounsaturated fat intake. In other interventional study (30), resistin levels decreased after a dietary intervention supplemented with wakame and carobs. Interestingly, on the basis of different components of Mediterranean diet (omega 3 fatty acids, monounsaturated fatty acids, resveratrol, quercetin, etc.), it has been suggested that bioactive molecules in the Mediterranean diet may improve different cardiovascular risk factors through modulation of gene expression (31).
A previous study (15) with a hypocaloric diet of 1,500 calories and a macronutrient distribution of 52 % of calories in the form of carbohydrates, 25 % in the form of lipids (50 % monounsaturated fats) and 23 % in the form of proteins, reported a different metabolic response based on the genetic variant rs10401670 of the RETN gene. These results were similar with a diet that reached the same caloric restriction, around 1,500 calories but with a higher fat percentage of 41 % with 60 % monounsaturated fats (32). The composition of this last diet is very similar to that of our present study, and when the variant rs3138167 was analyzed, we also found differences in metabolic parameters and resistin levels.
An interesting result of our work is the increased levels of resistin in T allele carriers with a worse metabolic status (insulin and HOMA-IR). It has been showed that resistin induces the synthesis of inflammatory cytokines in macrophages in adipose tissue and that inflammatory status induces expression of the resistin gene (33), as a vicious circle. Inflammation environment is well-known to be involved in the pathogenesis of insulin resistance, and circulating resistin could link inflammation and insulin resistance. For example, resistin is shown to elevate tumor necrosis factor-alpha (TNF-alpha) levels (34) and resistin decreases the secretion of anti-inflammatory adipokines such as adiponectin (35). All these metabolic environments generate resistance to insulin. In our present intervention study, no T-allele carriers improved inflammatory parameters (CRP), insulin and HOMA-IR with the same weight loss as the T allele carriers. The observed improvement in triglyceride levels may also be related to the improvement in the inflammatory status of patients that is observed after weight loss in T allele carriers. The role of resistin as an inflammatory molecule has been shown in other pathologies not related to obesity such as rheumatoid arthritis (36) and prothrombotic status (37).
The increased levels of resistin finding in our study in T allele carriers can be explained by various theories. First, it can be associated to specific binding of transcription factors Sp1 and Sp3 to a promoter element leading to increase promoter activity as showed with other SNPs (38). Second, this genetic variant may be in linkage disequilibrium with another SNP that modulates expression of resistin (38). Finally, this genetic variant would be part of a sequence of regulatory element that mediates the binding of coregulatory protein involved in the regulation of RETN and DC genes expression (39).
There are some limitations of our study. First, only one genetic variant has been evaluated. Second, it lacks a control group without a dietary intervention in order to compare the effect of weight loss. Third, new studies are necessary to validate these findings in overweight patients, as well as in diabetic patients and other high risk populations. Fourth, further studies are necessary to validate these findings in overweight patients, as well as in diabetic patients. Finally, the short duration of the clinical trial does not allow us to observe what would happen to the resistance levels during a longer period.
We report an association of rs3138167 with a worse metabolic response (insulin, HOMA-IR, triglyceride and CRP) in T allele carriers after weight loss with a hypocaloric diet with Mediterranean pattern.

